

Case Study 022. Voter Targets Dashboard: Step 1
Step 1. Discovery
My very first step was to gather background information on the district and flesh out my ideas for what a winning campaign strategy might be.

Arena Academy Voter Targets Dashboard: Step 1
Step 1. Discovery
My very first step was to gather background information on the district and flesh out my ideas for what a winning campaign strategy might be.

Case Study 022. Voter Targets Dashboard: Step 2
Step 2. Sketch
Next, I made a rough sketch of how the various segments of data relate to each other. I wanted to target voters by focusing on where certain segments of voters intersect.

Arena Academy Voter Targets Dashboard: Step 2
Step 2. Sketch
Next, I made a rough sketch of how the various segments of data relate to each other. I wanted to target voters by focusing on where certain segments of voters intersect.

Case Study 022. Voter Targets Dashboard: Step 3
Step 3. Prep Data
Then, I wrote SQL code to:
Pull and combine voter data stored in different locations
Filter the data by my campaign’s congressional district
Group voters into buckets by age range
Assign tiers to voters based on their attributes and voting records
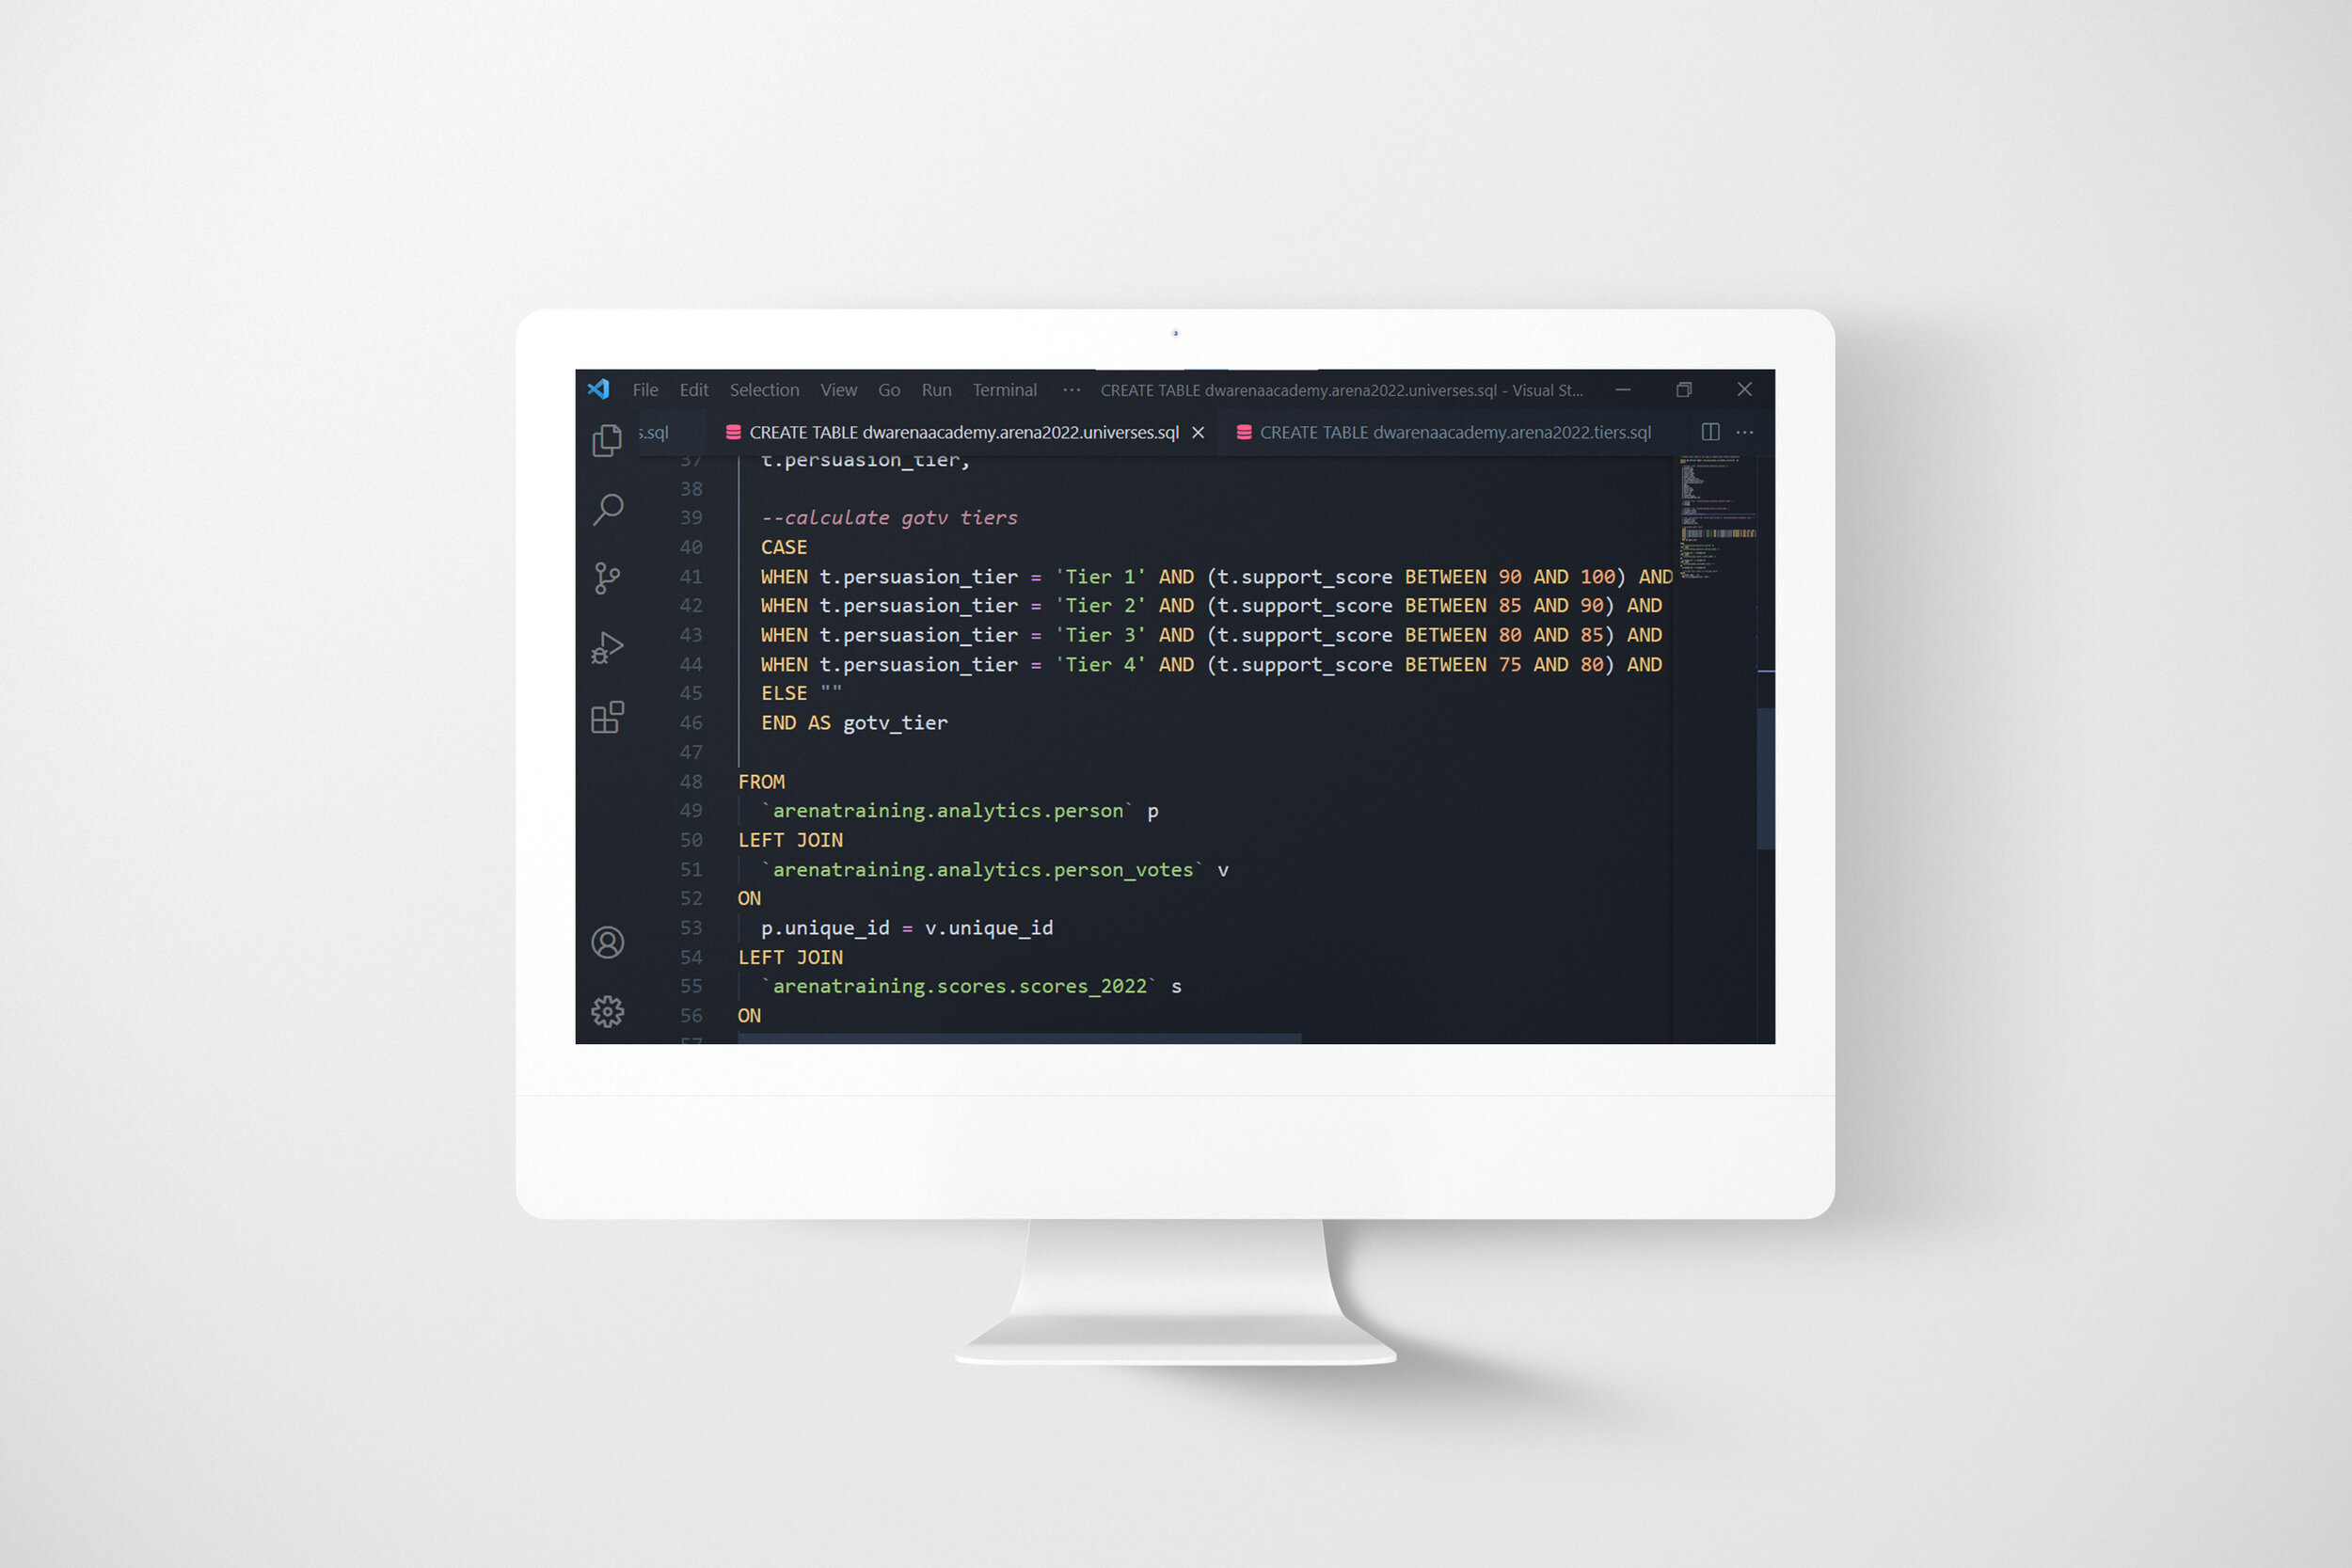
Arena Academy Voter Targets Dashboard: Step 3
Step 3. Prep Data
Then, I wrote SQL code to:
Pull and combine voter data stored in different locations
Filter the data by my campaign’s congressional district
Group voters into buckets by age range
Assign tiers to voters based on their attributes and voting records

Case Study 022. Voter Targets Dashboard: Step 4
Step 4. Build
I took the output of the code I wrote in step 3 and I connected it to Google Data Studio. Inside of Data Studio, I built out an interactive data visualization which highlighted our voter targeting strategy.

Arena Academy Voter Targets Dashboard: Step 4
Step 4. Build
I took the output of the code I wrote in step 3 and I connected it to Google Data Studio. Inside of Data Studio, I built out an interactive data visualization which highlighted our voter targeting strategy.

Case Study 022. Voter Targets Dashboard: Step 5
Step 5. Publish
I published the final report to the cloud using Google Data Studio and I used screenshots from the dashboard to create slides used in our presentation.

Arena Academy Voter Targets Dashboard: Step 5
Step 5. Publish
I published the final report to the cloud using Google Data Studio and I used screenshots from the dashboard to create slides used in our presentation.

Case Study 020. Tuition Assistance Program Infographic: Step 1
Step 1 - Discovery
My very first step was to gather all of the information I had and flesh out my ideas for what the infographic would communicate.

Tuition Assistance Program Infographic: Step 1
Step 1 - Discovery
My very first step was to gather all of the information I had and flesh out my ideas for what the infographic would communicate.

Case Study 020. Tuition Assistance Program Infographic: Step 2
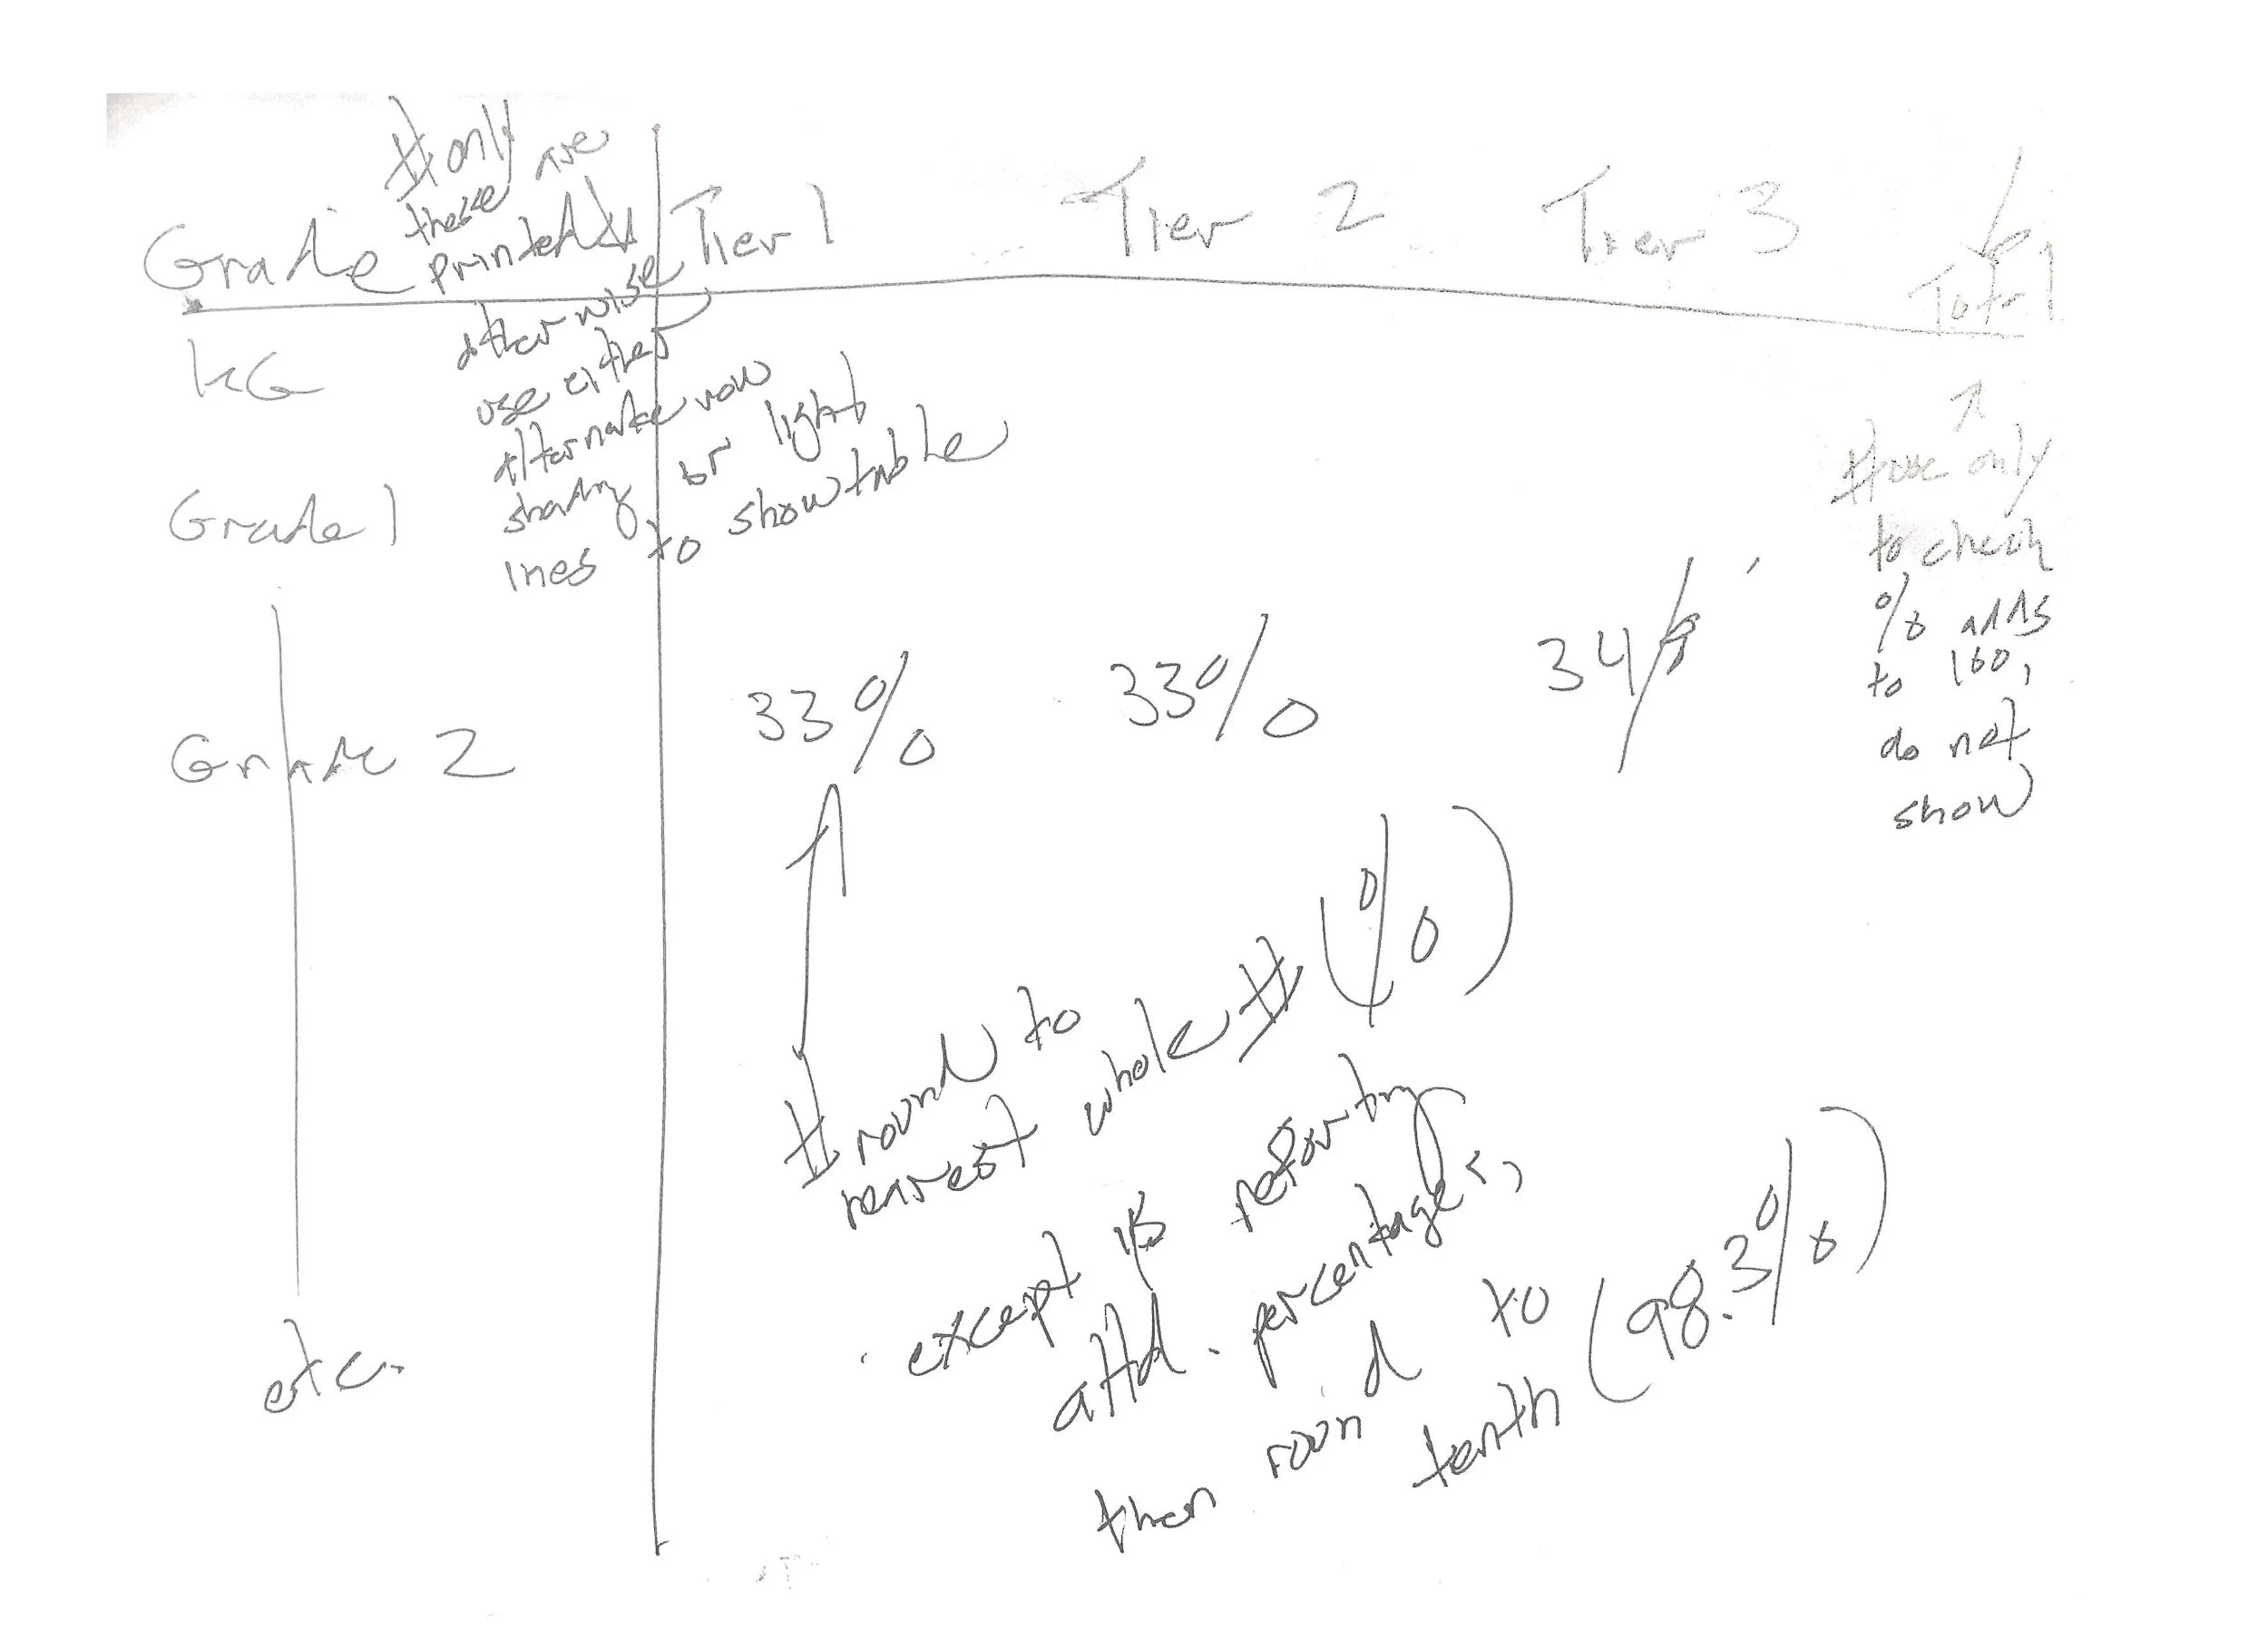
Step 2 - Sketch
Next, I made a rough sketch of what the infographic would look like and what information would go where. I used a grid structure so my design would look balanced and well-organized.

Tuition Assistance Program Infographic: Step 2
Step 2 - Sketch
Next, I made a rough sketch of what the infographic would look like and what information would go where. I used a grid structure so my design would look balanced and well-organized.

Case Study 020. Tuition Assistance Program Infographic: Step 3
Step 3 - Prep Data
I located the financial aid data file on data.gov and downloaded it to my computer. I then uploaded it to my GitHub repository so I would be able to access it from any computer and others could easily access the data once my work was published.
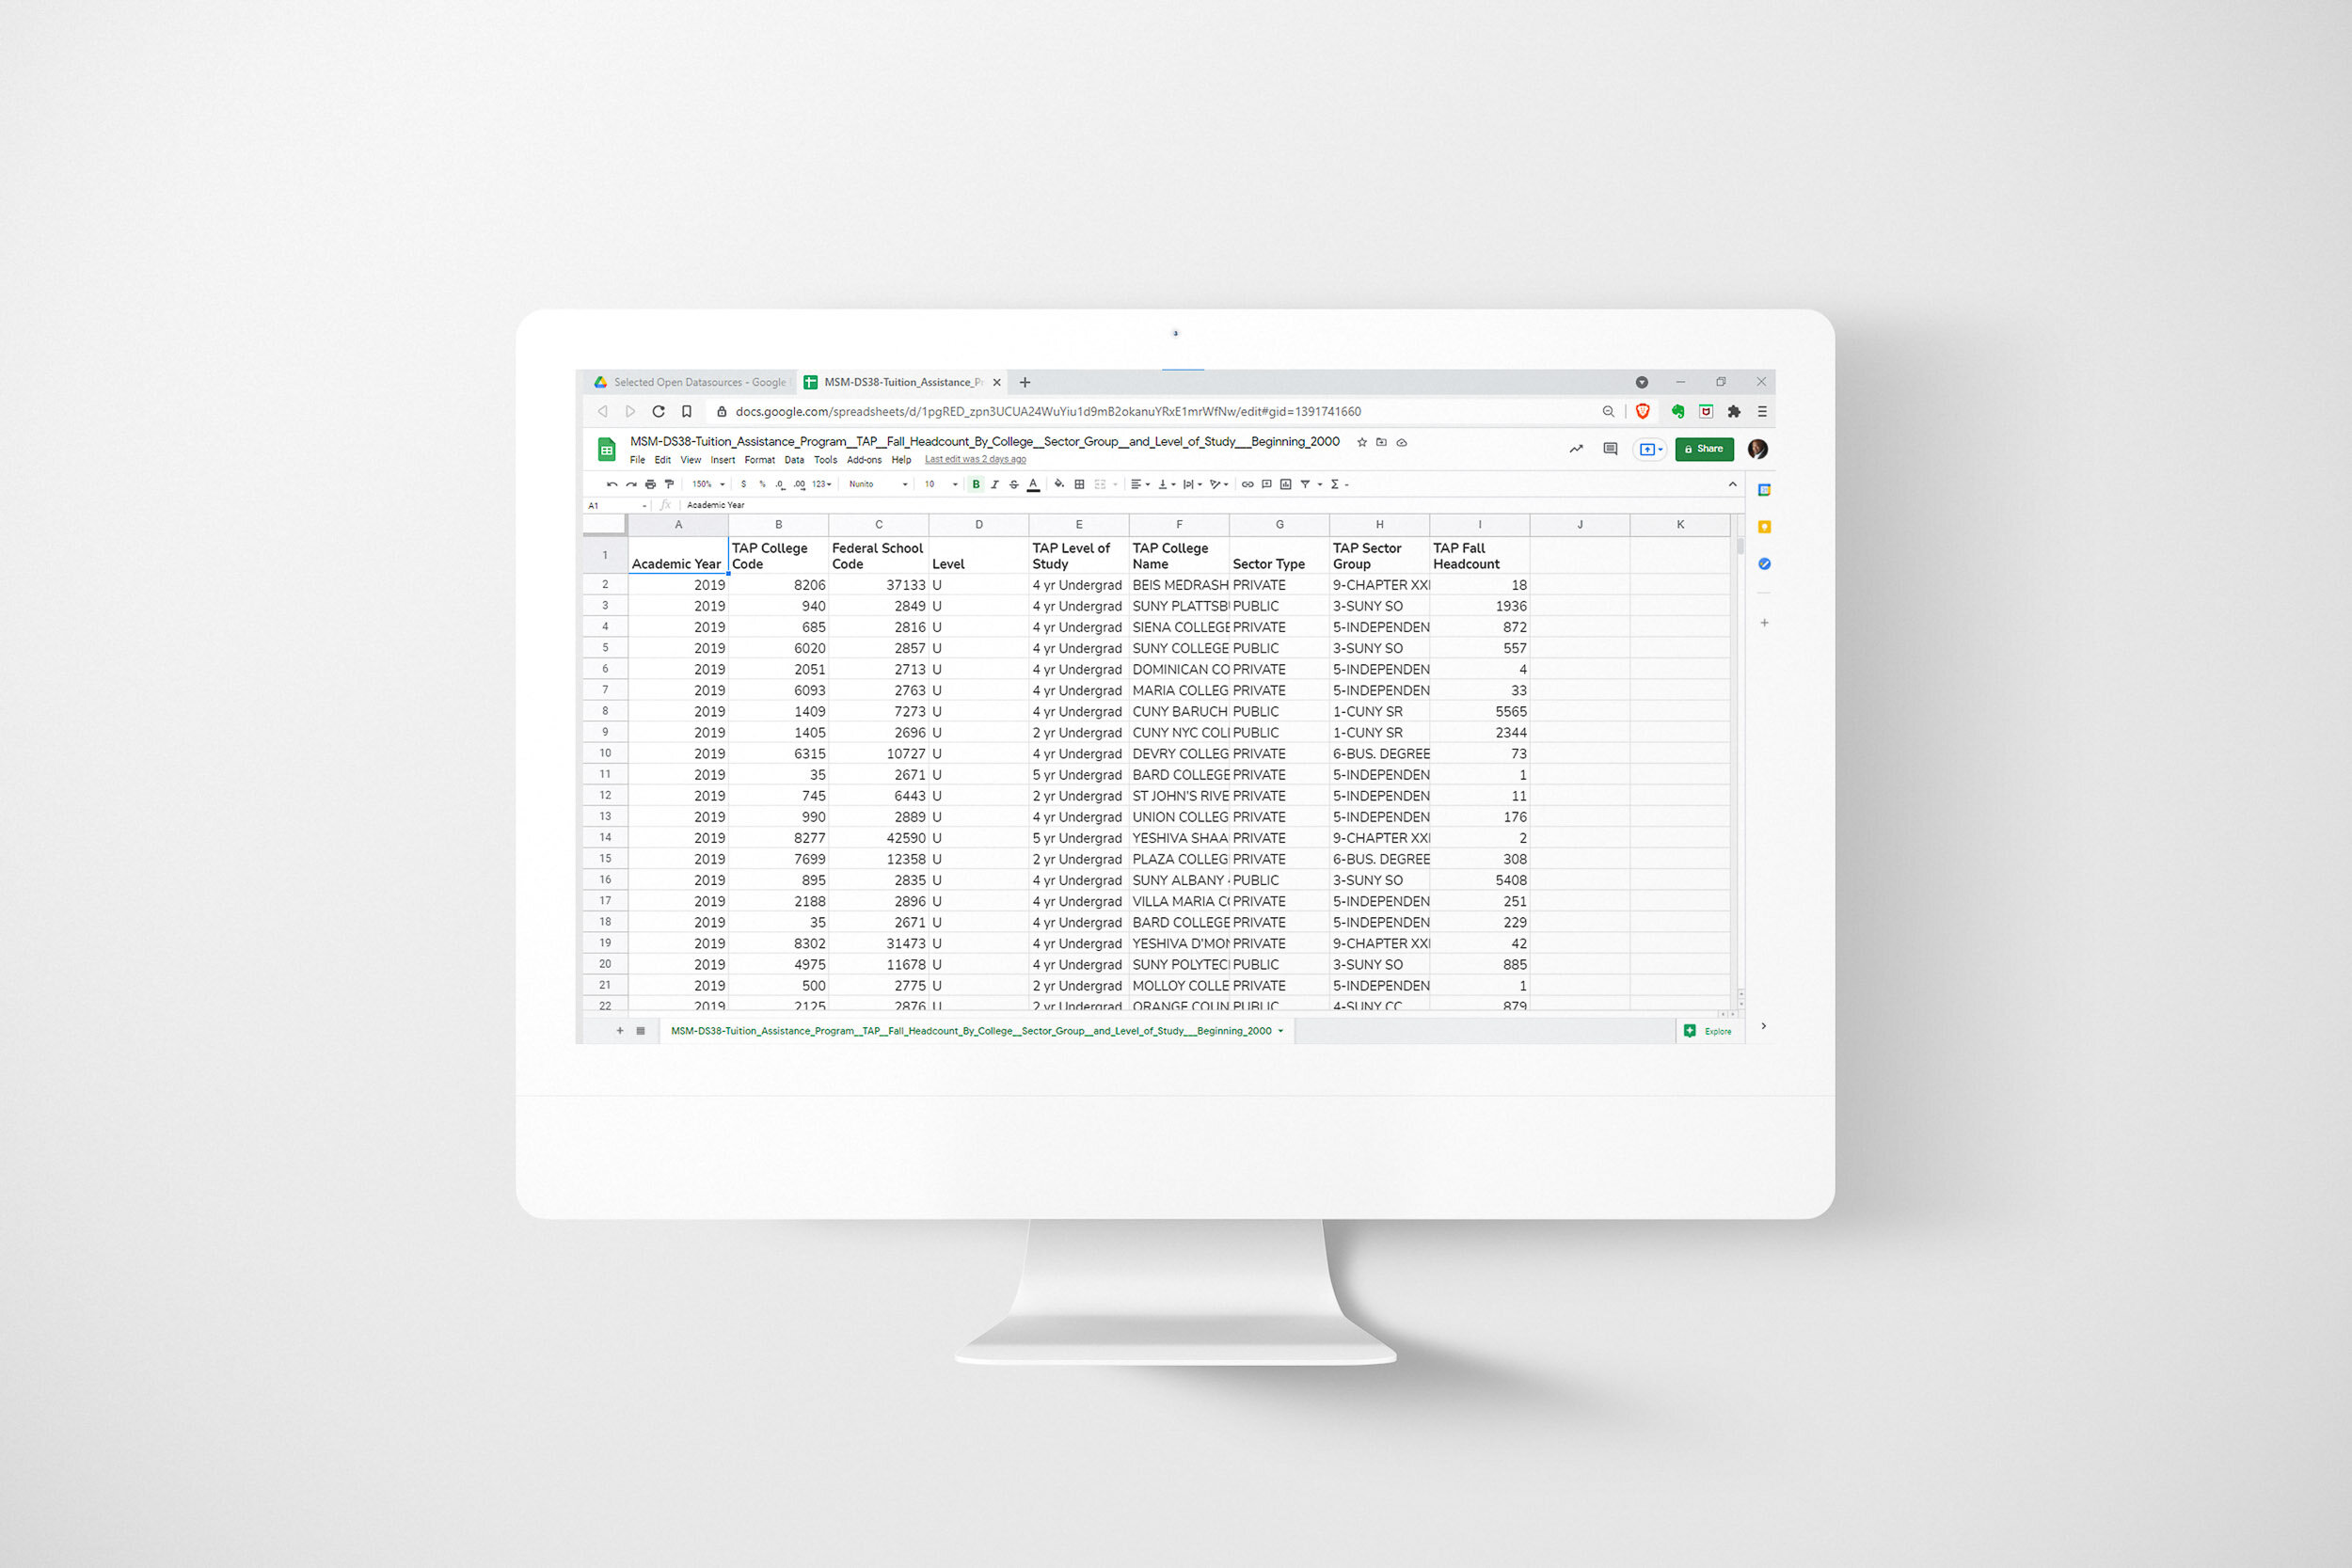
Tuition Assistance Program Infographic: Step 3
Step 3 - Prep Data
I located the financial aid data file on data.gov and downloaded it to my computer. I then uploaded it to my GitHub repository so I would be able to access it from any computer and others could easily access the data once my work was published.
Case Study 020. Tuition Assistance Program Infographic: Step 4
Step 4 - Build
I calculated summary statistics using Python code and Google Colab. I chose Python because Python is capable of processing a large volume of data quickly and efficiently.

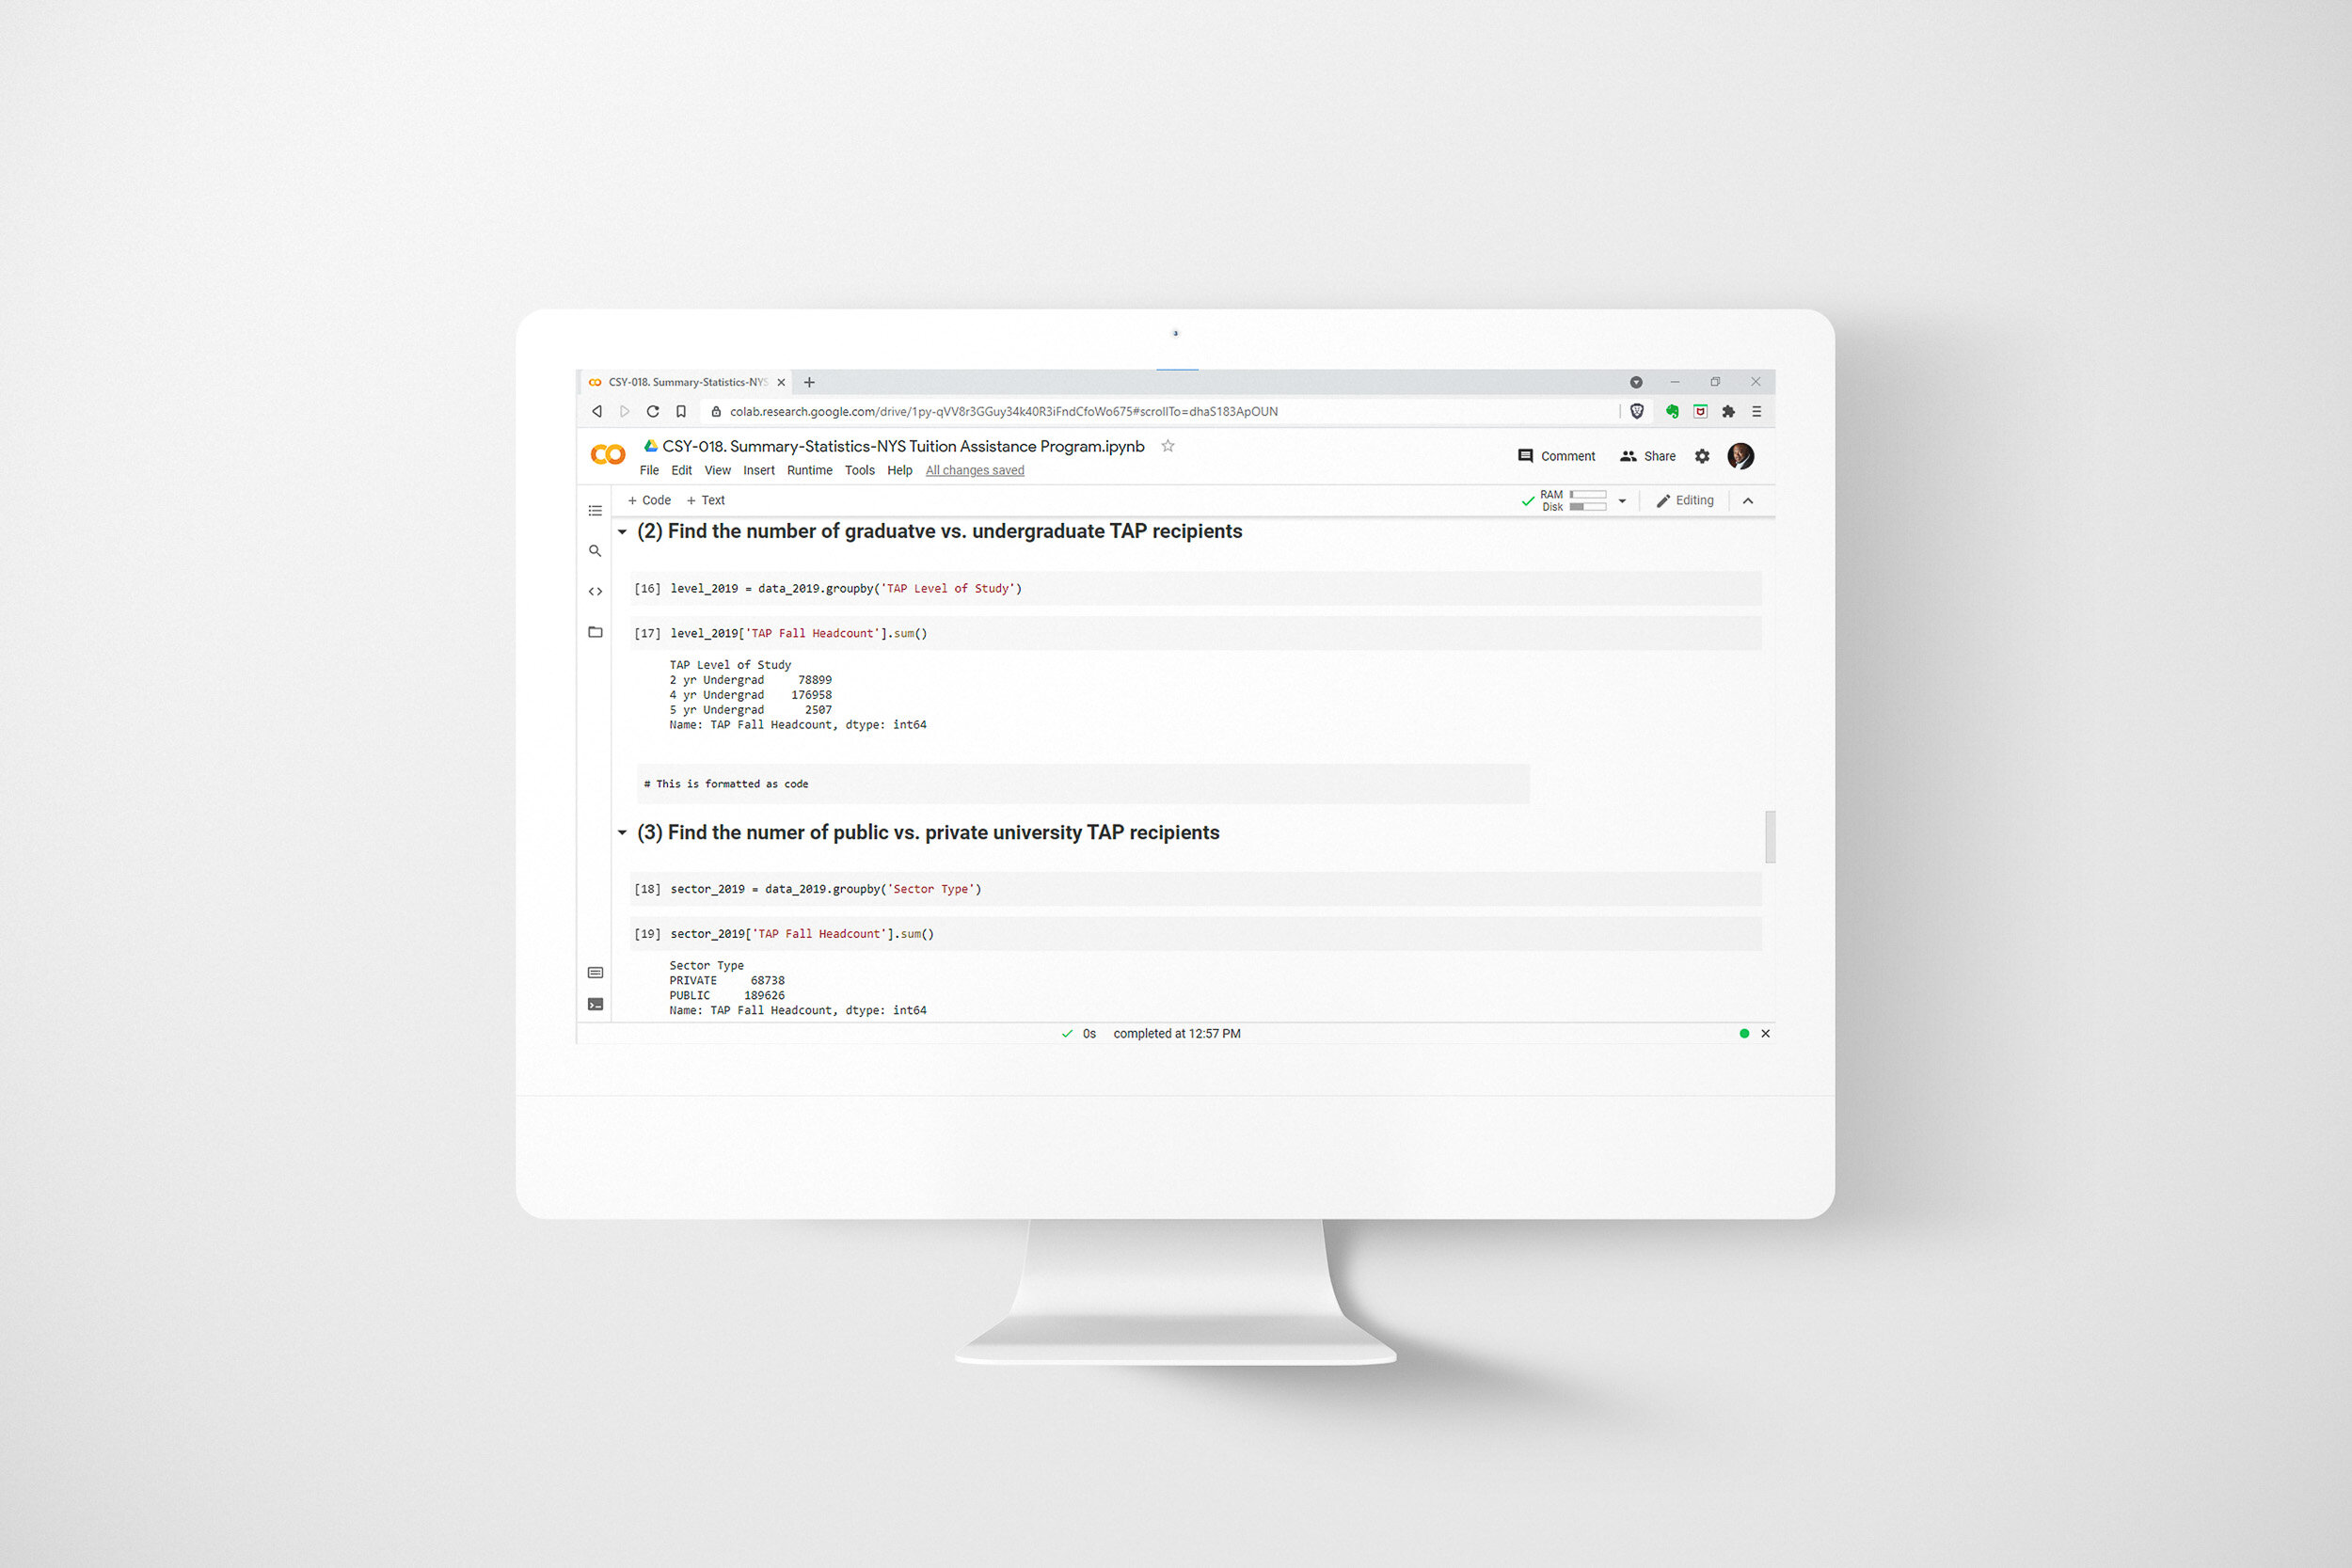
Tuition Assistance Program Infographic: Step 4
Step 4 - Build
I calculated summary statistics using Python code and Google Colab. I chose Python because Python is capable of processing a large volume of data quickly and efficiently.

Case Study 020. Tuition Assistance Program Infographic: Step 5
Step 5 - Publish
Finally, I created the graphic using Adobe Illustrator. Once finished, I exported the file in PNG format (image) and PDF format (document). Either format can easily be printed, shared via email or hosted online.

Tuition Assistance Program Infographic: Step 5
Step 5 - Publish
Finally, I created the graphic using Adobe Illustrator. Once finished, I exported the file in PNG format (image) and PDF format (document). Either format can easily be printed, shared via email or hosted online.

Case Study 017. Harlem Link Data Suite - Academics: Step 1
Step 1 - Discovery
To begin the process of creating the data reports, I met with the school’s teachers and administrators. I listened to the concerns they had and the challenges they were facing. I began to form an idea of what information needed to be included in the data reports and what raw data needed to be gathered.

Harlem Link Data Suite - Academics: Step 1
Step 1 - Discovery
To begin the process of creating the data reports, I met with the school’s teachers and administrators. I listened to the concerns they had and the challenges they were facing. I began to form an idea of what information needed to be included in the data reports and what raw data needed to be gathered.

Case Study 017. Harlem Link Data Suite - Academics: Step 2
Step 2 - Sketch
Next, I made a rough sketch of what the reports would look like and what information would go where on the screen.

Harlem Link Data Suite - Academics: Step 2
Step 2 - Sketch
Next, I made a rough sketch of what the reports would look like and what information would go where on the screen.

Case Study 017. Harlem Link Data Suite - Academics: Step 3
Step 3 - Prep Data
To complete this step, I took the following actions:
I identified exactly what data needed to be displayed.
I identified sources for each of those data points.
I exported that data from school information systems (or requested a data export from an outside source).
I cleaned up and organized the data exports.
I compiled the data into Google Sheets.

Harlem Link Data Suite - Academics: Step 3
Step 3 - Prep Data
To complete this step, I took the following actions:
I identified exactly what data needed to be displayed.
I identified sources for each of those data points.
I exported that data from school information systems (or requested a data export from an outside source).
I cleaned up and organized the data exports.
I compiled the data into Google Sheets.

Case Study 017. Harlem Link Data Suite - Academics: Step 4
Step 4 - Build
Next, I took the Google Sheets datasources I’d just compiled and I connected them to Google Data Studio. I began to build out the reports inside of Data Studio.

Harlem Link Data Suite - Academics: Step 4
Step 4 - Build
Next, I took the Google Sheets datasources I’d just compiled and I connected them to Google Data Studio. I began to build out the reports inside of Data Studio.

Case Study 017. Harlem Link Data Suite - Academics: Step 5
Step 5 - Publish
I published the finished reports to the cloud using Google Data Studio and I shared them with all stakeholders. Since the documents were based online, all members of the team could review the data prior to their team meetings and arrive prepared to contribute to the group discussion.

Harlem Link Data Suite - Academics: Step 5
Step 5 - Publish
I published the finished reports to the cloud using Google Data Studio and I shared them with all stakeholders. Since the documents were based online, all members of the team could review the data prior to their team meetings and arrive prepared to contribute to the group discussion.
Case Study 016. Harlem Link Data Suite - Social Emotional Learning: Step 1
Step 1 - Discovery
To begin the process of creating the data report, I met with the school’s teachers and administrators. I listened to the concerns they had and the challenges they were facing. I began to form an idea of what information needed to be included in the final report and what raw data needed to be gathered.

Harlem Link Data Suite - Social Emotional Learning: Step 1
Step 1 - Discovery
To begin the process of creating the data report, I met with the school’s teachers and administrators. I listened to the concerns they had and the challenges they were facing. I began to form an idea of what information needed to be included in the final report and what raw data needed to be gathered.

Case Study 016. Harlem Link Data Suite - Social Emotional Learning: Step 2
Step 2 - Sketch
Next, I made a rough sketch of what the reports would look like and what information would go where on the screen.

Harlem Link Data Suite - Social Emotional Learning: Step 2
Step 2 - Sketch
Next, I made a rough sketch of what the reports would look like and what information would go where on the screen.

Case Study 016. Harlem Link Data Suite - Social Emotional Learning: Step 3
Step 3 - Prep Data
To complete this step, I took the following actions:
I identified exactly what data needed to be displayed.
I identified sources for each of those data points.
I exported that data from school information systems (or requested a data export from an outside source).
I cleaned up and organized the data exports.
I compiled the data into Google Sheets.

Harlem Link Data Suite - Social Emotional Learning: Step 3
Step 3 - Prep Data
To complete this step, I took the following actions:
I identified exactly what data needed to be displayed.
I identified sources for each of those data points.
I exported that data from school information systems (or requested a data export from an outside source).
I cleaned up and organized the data exports.
I compiled the data into Google Sheets.

Case Study 016. Harlem Link Data Suite - Social Emotional Learning: Step 4
Step 4 - Build
Next, I took the Google Sheets datasources I’d just compiled and I connected them to Google Data Studio. I began to build out the report inside of Data Studio.
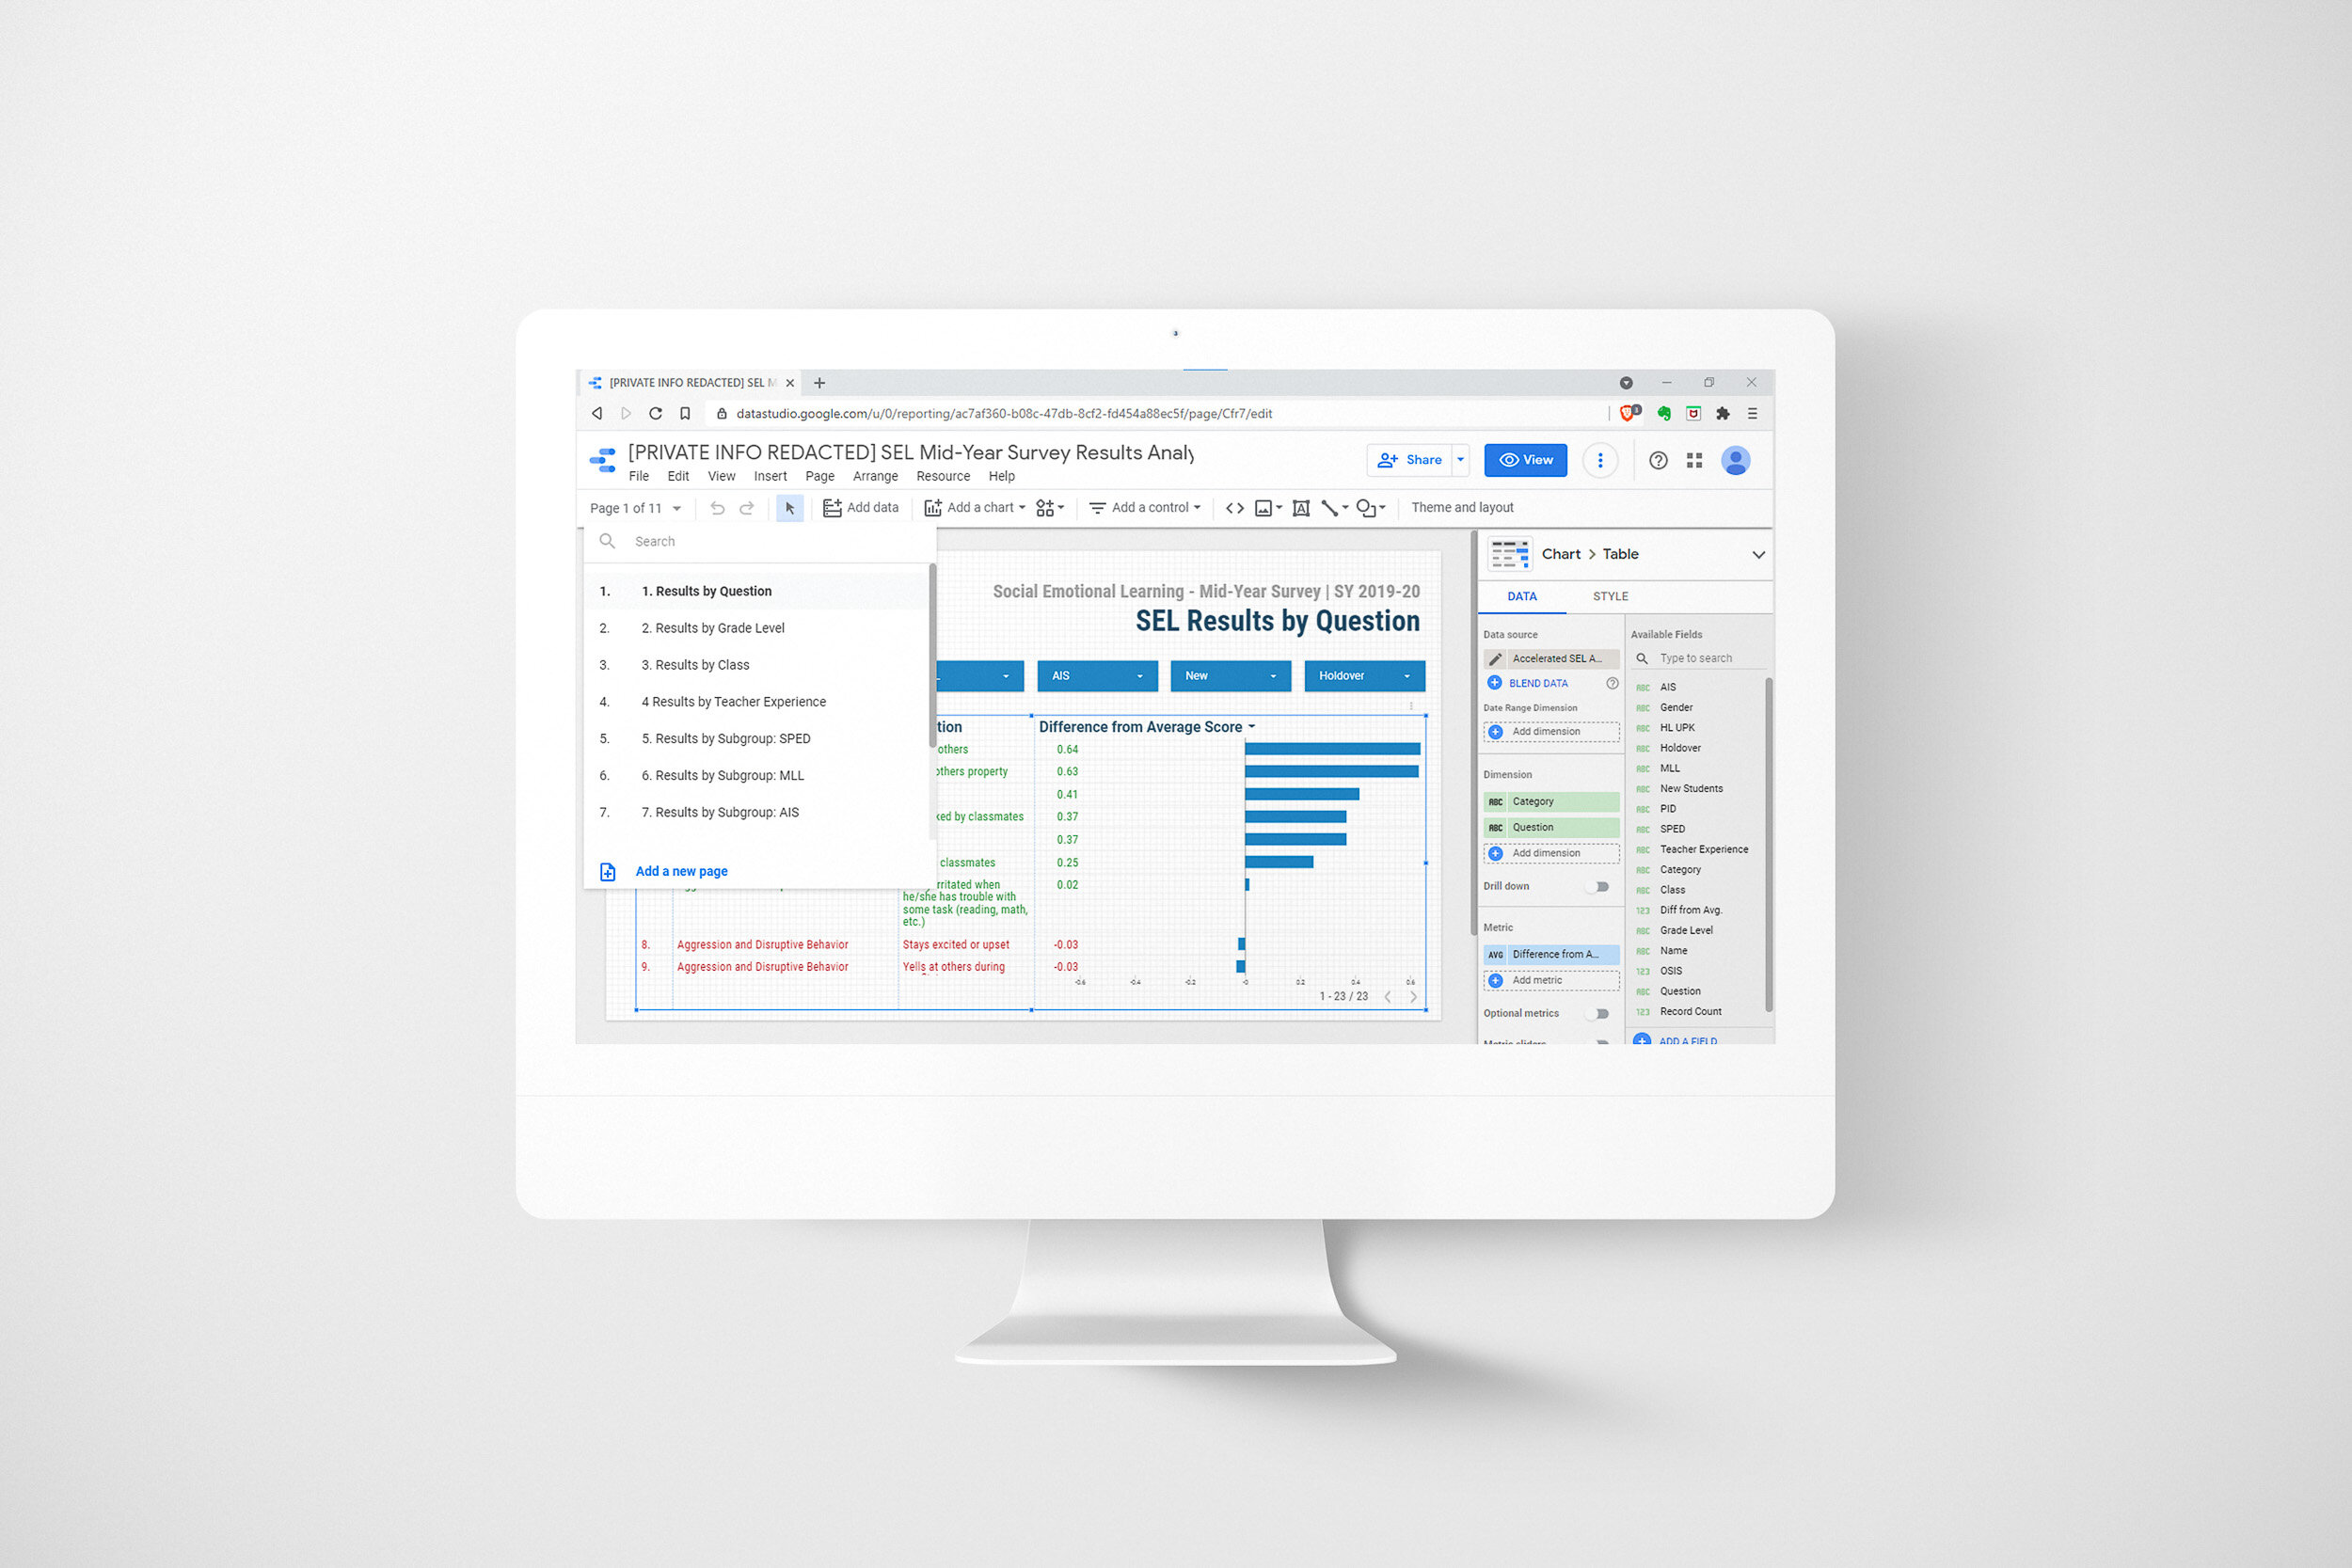
Harlem Link Data Suite - Social Emotional Learning: Step 4
Step 4 - Build
Next, I took the Google Sheets datasources I’d just compiled and I connected them to Google Data Studio. I began to build out the report inside of Data Studio.

Case Study 016. Harlem Link Data Suite - Social Emotional Learning: Step 5
Step 5 - Publish
I published the finished report to the cloud using Google Data Studio and I shared them with all stakeholders. Since the document was based online, all members of the team could review the data prior to the data meeting and arrive prepared to contribute to the group discussion.

Harlem Link Data Suite - Social Emotional Learning: Step 5
Step 5 - Publish
I published the finished report to the cloud using Google Data Studio and I shared them with all stakeholders. Since the document was based online, all members of the team could review the data prior to the data meeting and arrive prepared to contribute to the group discussion.