

Case Study 022. Voter Targets Dashboard: Step 1
Step 1. Discovery
My very first step was to gather background information on the district and flesh out my ideas for what a winning campaign strategy might be.

Arena Academy Voter Targets Dashboard: Step 1
Step 1. Discovery
My very first step was to gather background information on the district and flesh out my ideas for what a winning campaign strategy might be.

Case Study 022. Voter Targets Dashboard: Step 2
Step 2. Sketch
Next, I made a rough sketch of how the various segments of data relate to each other. I wanted to target voters by focusing on where certain segments of voters intersect.

Arena Academy Voter Targets Dashboard: Step 2
Step 2. Sketch
Next, I made a rough sketch of how the various segments of data relate to each other. I wanted to target voters by focusing on where certain segments of voters intersect.

Case Study 022. Voter Targets Dashboard: Step 3
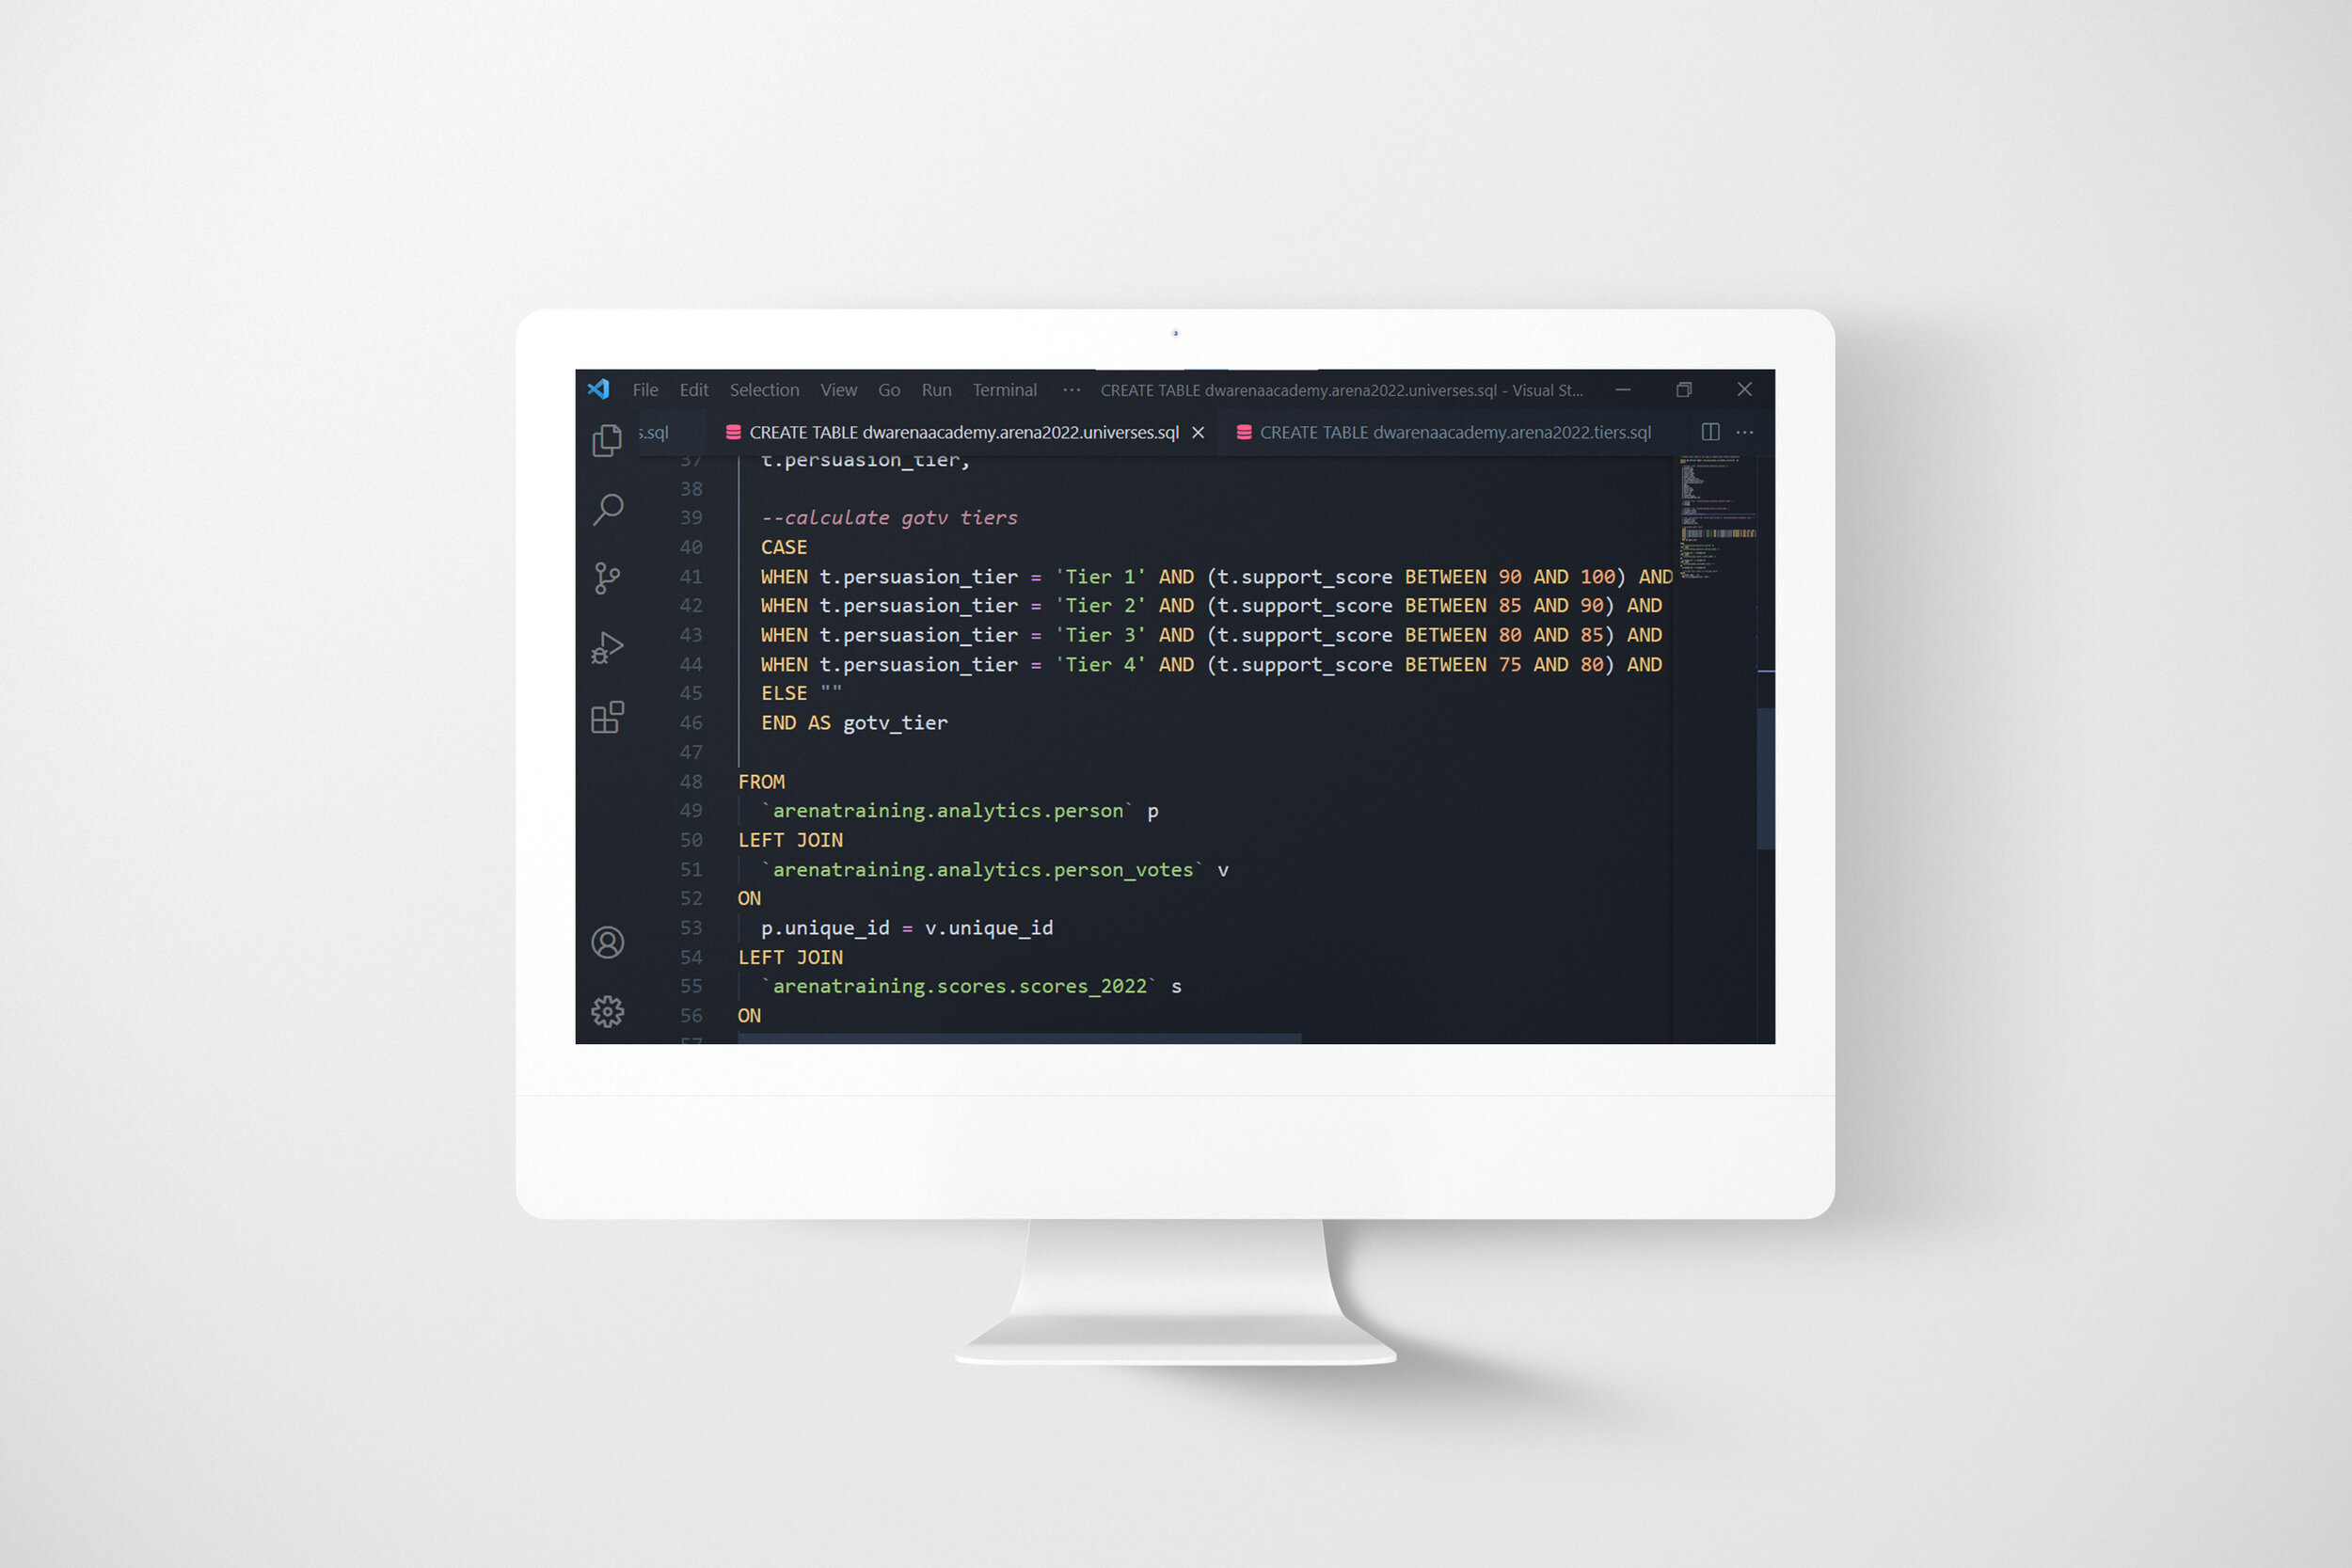
Step 3. Prep Data
Then, I wrote SQL code to:
Pull and combine voter data stored in different locations
Filter the data by my campaign’s congressional district
Group voters into buckets by age range
Assign tiers to voters based on their attributes and voting records
Arena Academy Voter Targets Dashboard: Step 3
Step 3. Prep Data
Then, I wrote SQL code to:
Pull and combine voter data stored in different locations
Filter the data by my campaign’s congressional district
Group voters into buckets by age range
Assign tiers to voters based on their attributes and voting records

Case Study 022. Voter Targets Dashboard: Step 4
Step 4. Build
I took the output of the code I wrote in step 3 and I connected it to Google Data Studio. Inside of Data Studio, I built out an interactive data visualization which highlighted our voter targeting strategy.

Arena Academy Voter Targets Dashboard: Step 4
Step 4. Build
I took the output of the code I wrote in step 3 and I connected it to Google Data Studio. Inside of Data Studio, I built out an interactive data visualization which highlighted our voter targeting strategy.

Case Study 022. Voter Targets Dashboard: Step 5
Step 5. Publish
I published the final report to the cloud using Google Data Studio and I used screenshots from the dashboard to create slides used in our presentation.

Arena Academy Voter Targets Dashboard: Step 5
Step 5. Publish
I published the final report to the cloud using Google Data Studio and I used screenshots from the dashboard to create slides used in our presentation.