
Case Study 013. Jazzfuel.com COVID-19 Survey Results Visualization: Step 4
Step 4 - Build
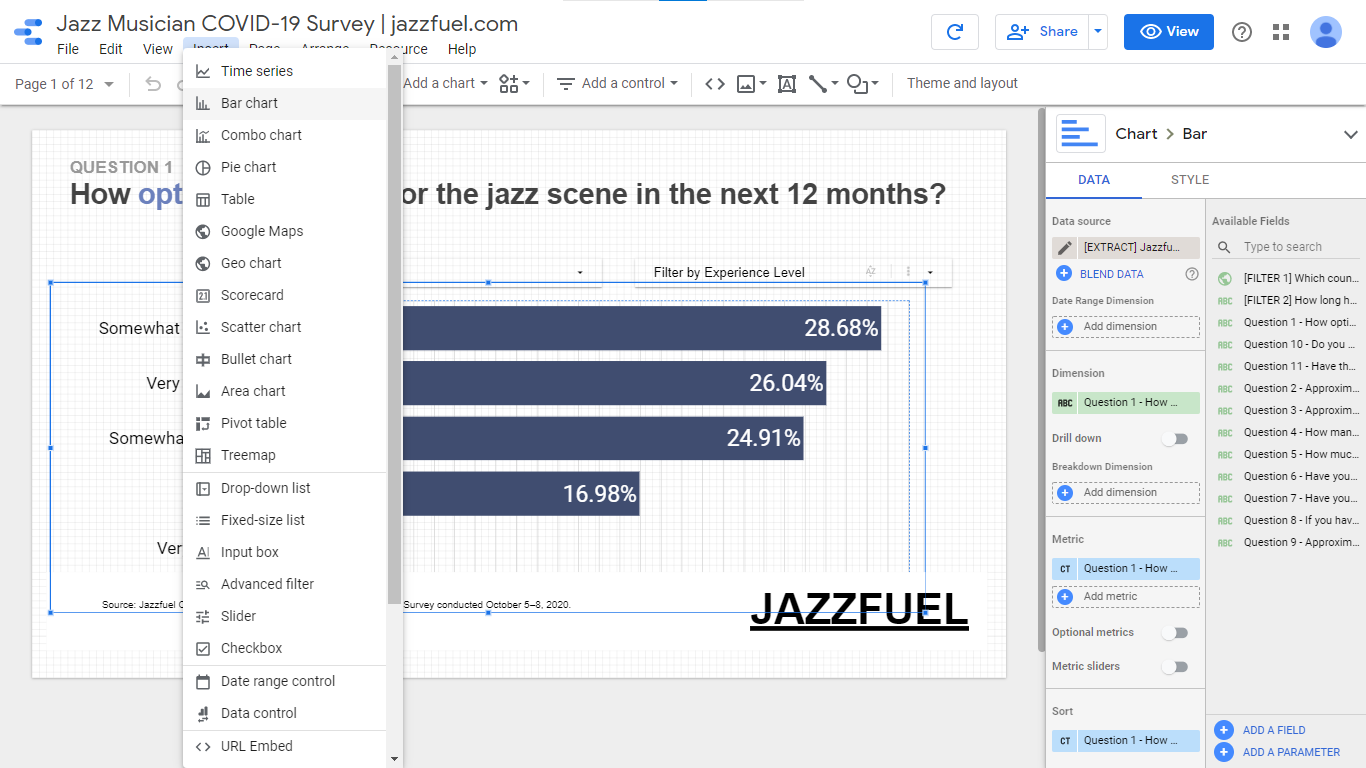
To build out the visualization, I chose to use Google Data Studio. I chose Data Studio because it can easily be shared (via a link) and/or embedded into a website.

Jazzfuel Dashboard: Work Process Step 4 of 5
Step 4 - Build
To build out the visualization, I chose to use Google Data Studio. I chose Data Studio because it can easily be shared (via a link) and/or embedded into a website.

Case Study 013. Jazzfuel.com COVID-19 Survey Results Visualization: Step 5
Step 5 - Publish
Once I finished building out the visualization and connecting it to the data source, I published the visualization and shared it online.

Jazzfuel Dashboard: Work Process Step 5 of 5
Step 5 - Publish
Once I finished building out the visualization and connecting it to the data source, I published the visualization and shared it online.