

Case Study 017. Harlem Link Data Suite - Academics: Step 1
Step 1 - Discovery
To begin the process of creating the data reports, I met with the school’s teachers and administrators. I listened to the concerns they had and the challenges they were facing. I began to form an idea of what information needed to be included in the data reports and what raw data needed to be gathered.

Harlem Link Data Suite - Academics: Step 1
Step 1 - Discovery
To begin the process of creating the data reports, I met with the school’s teachers and administrators. I listened to the concerns they had and the challenges they were facing. I began to form an idea of what information needed to be included in the data reports and what raw data needed to be gathered.

Case Study 017. Harlem Link Data Suite - Academics: Step 2
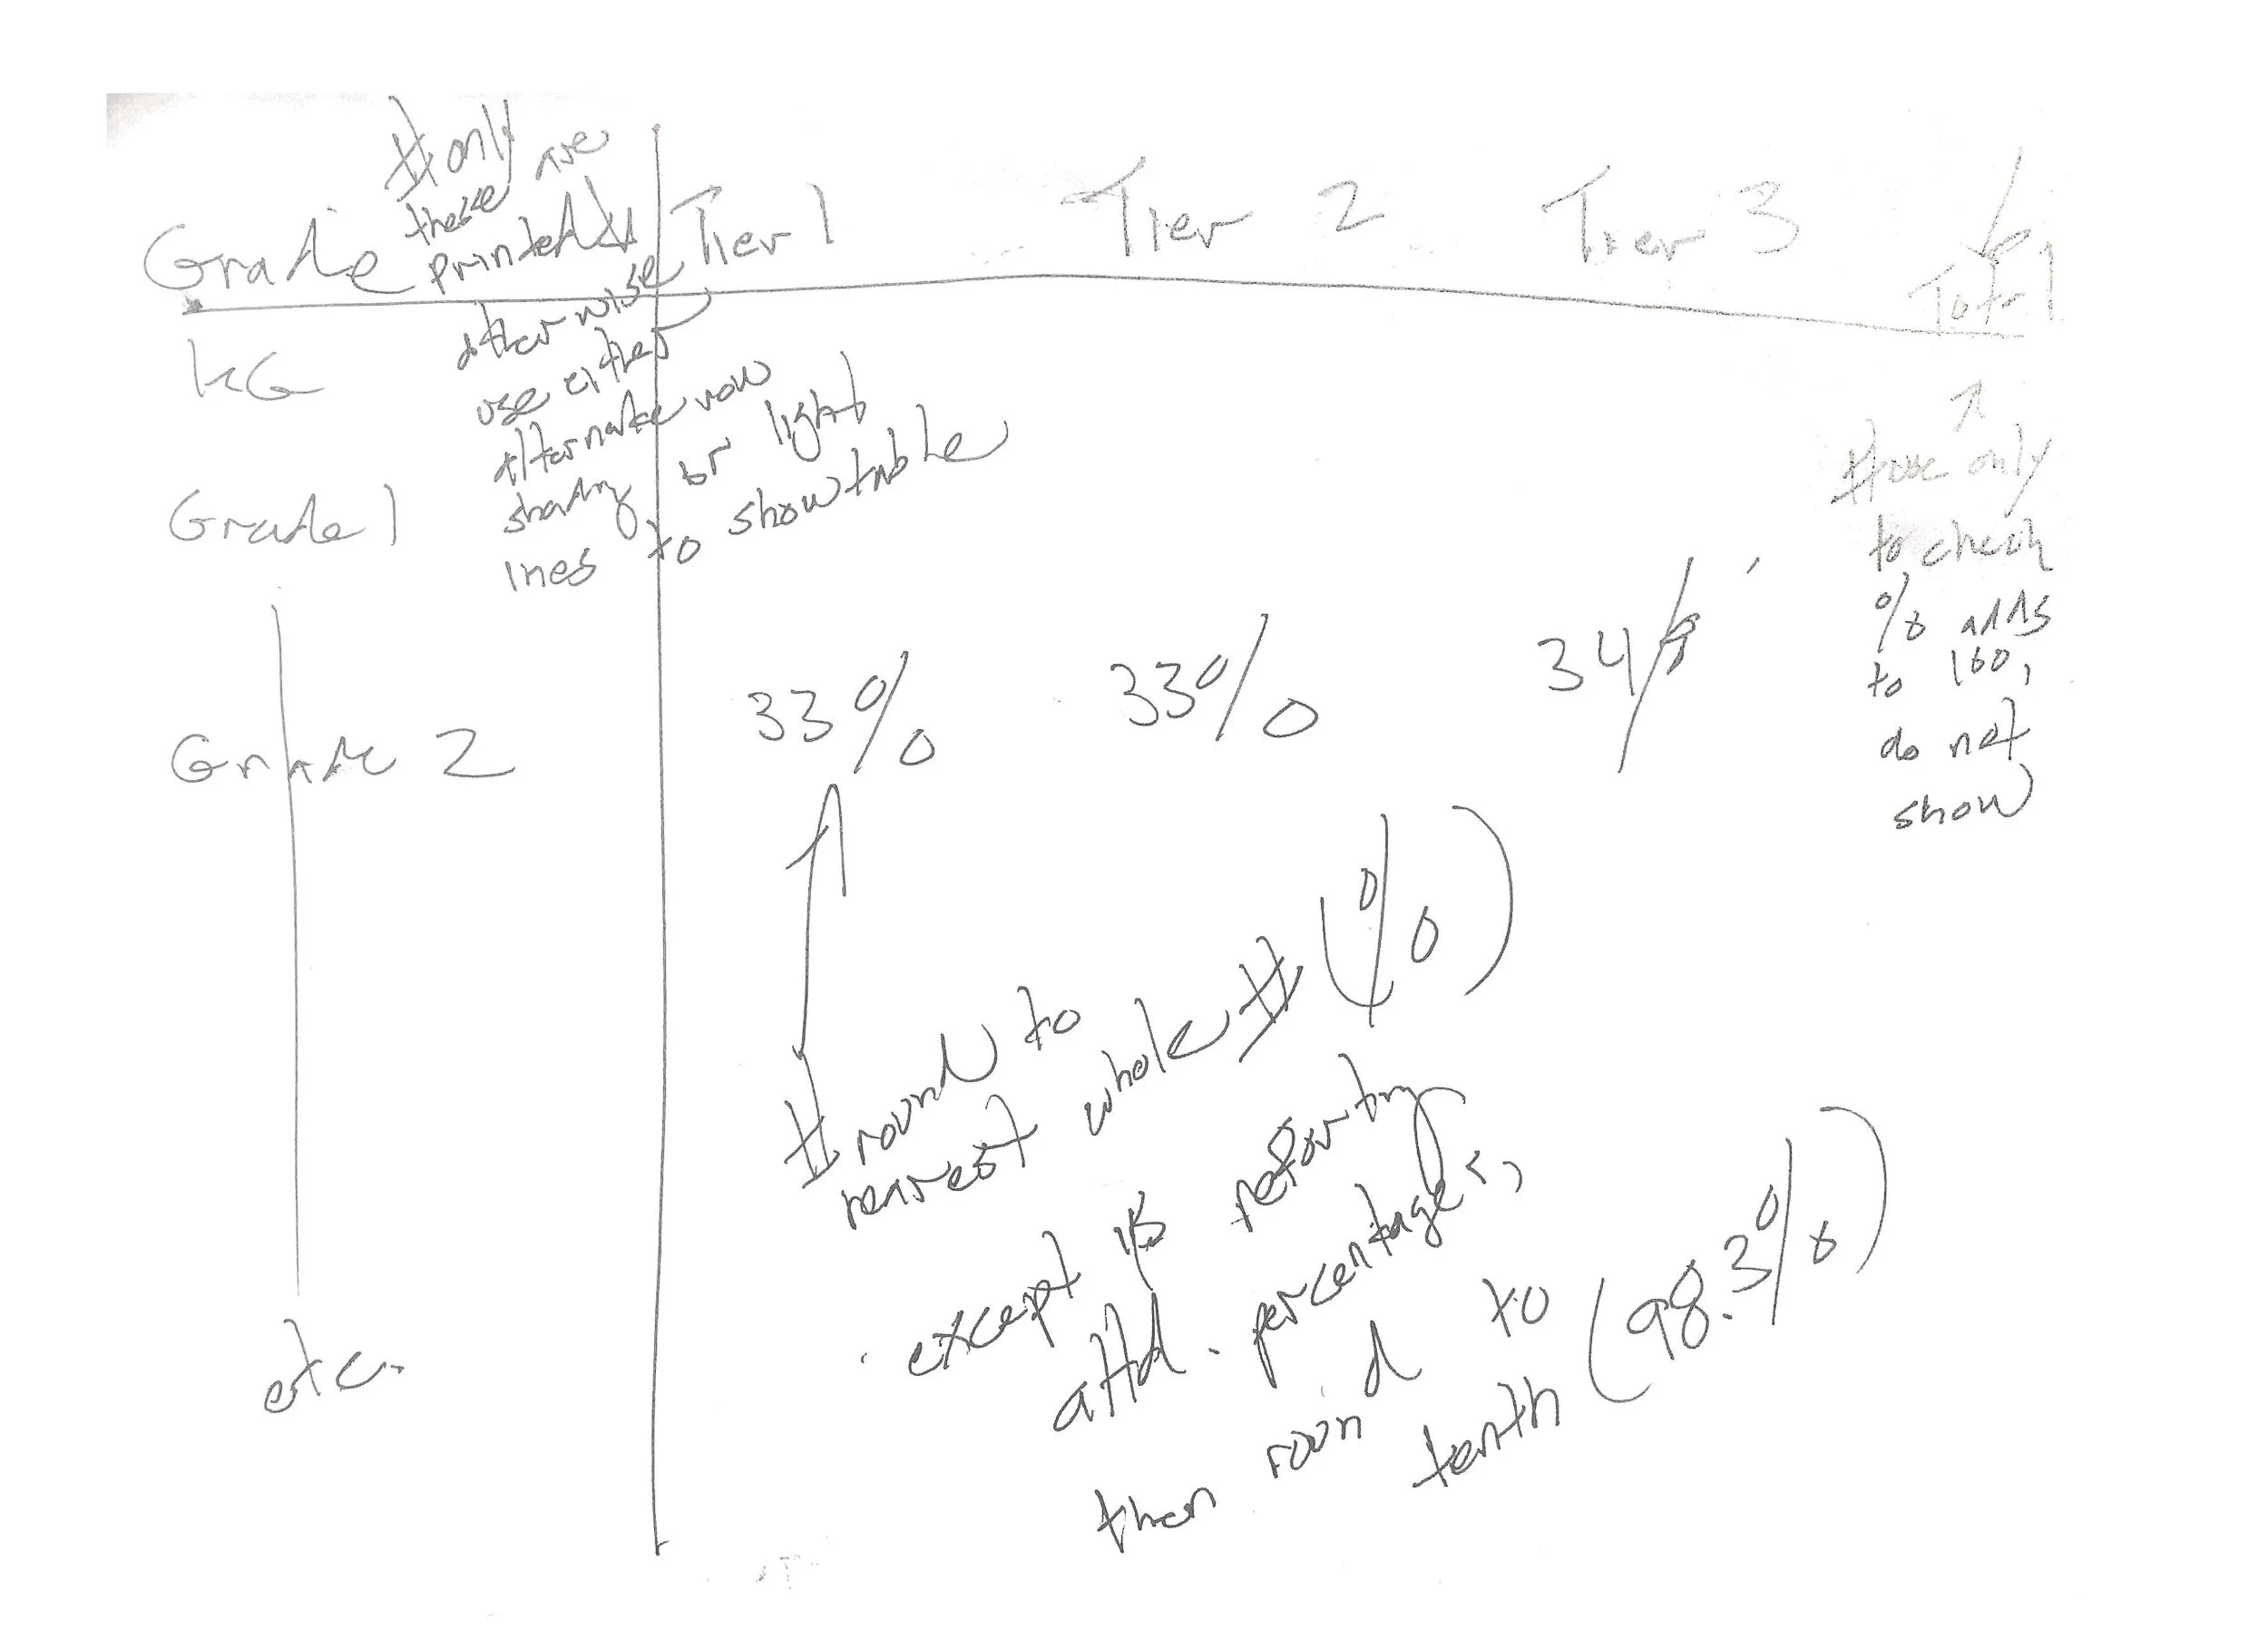
Step 2 - Sketch
Next, I made a rough sketch of what the reports would look like and what information would go where on the screen.

Harlem Link Data Suite - Academics: Step 2
Step 2 - Sketch
Next, I made a rough sketch of what the reports would look like and what information would go where on the screen.

Case Study 017. Harlem Link Data Suite - Academics: Step 3
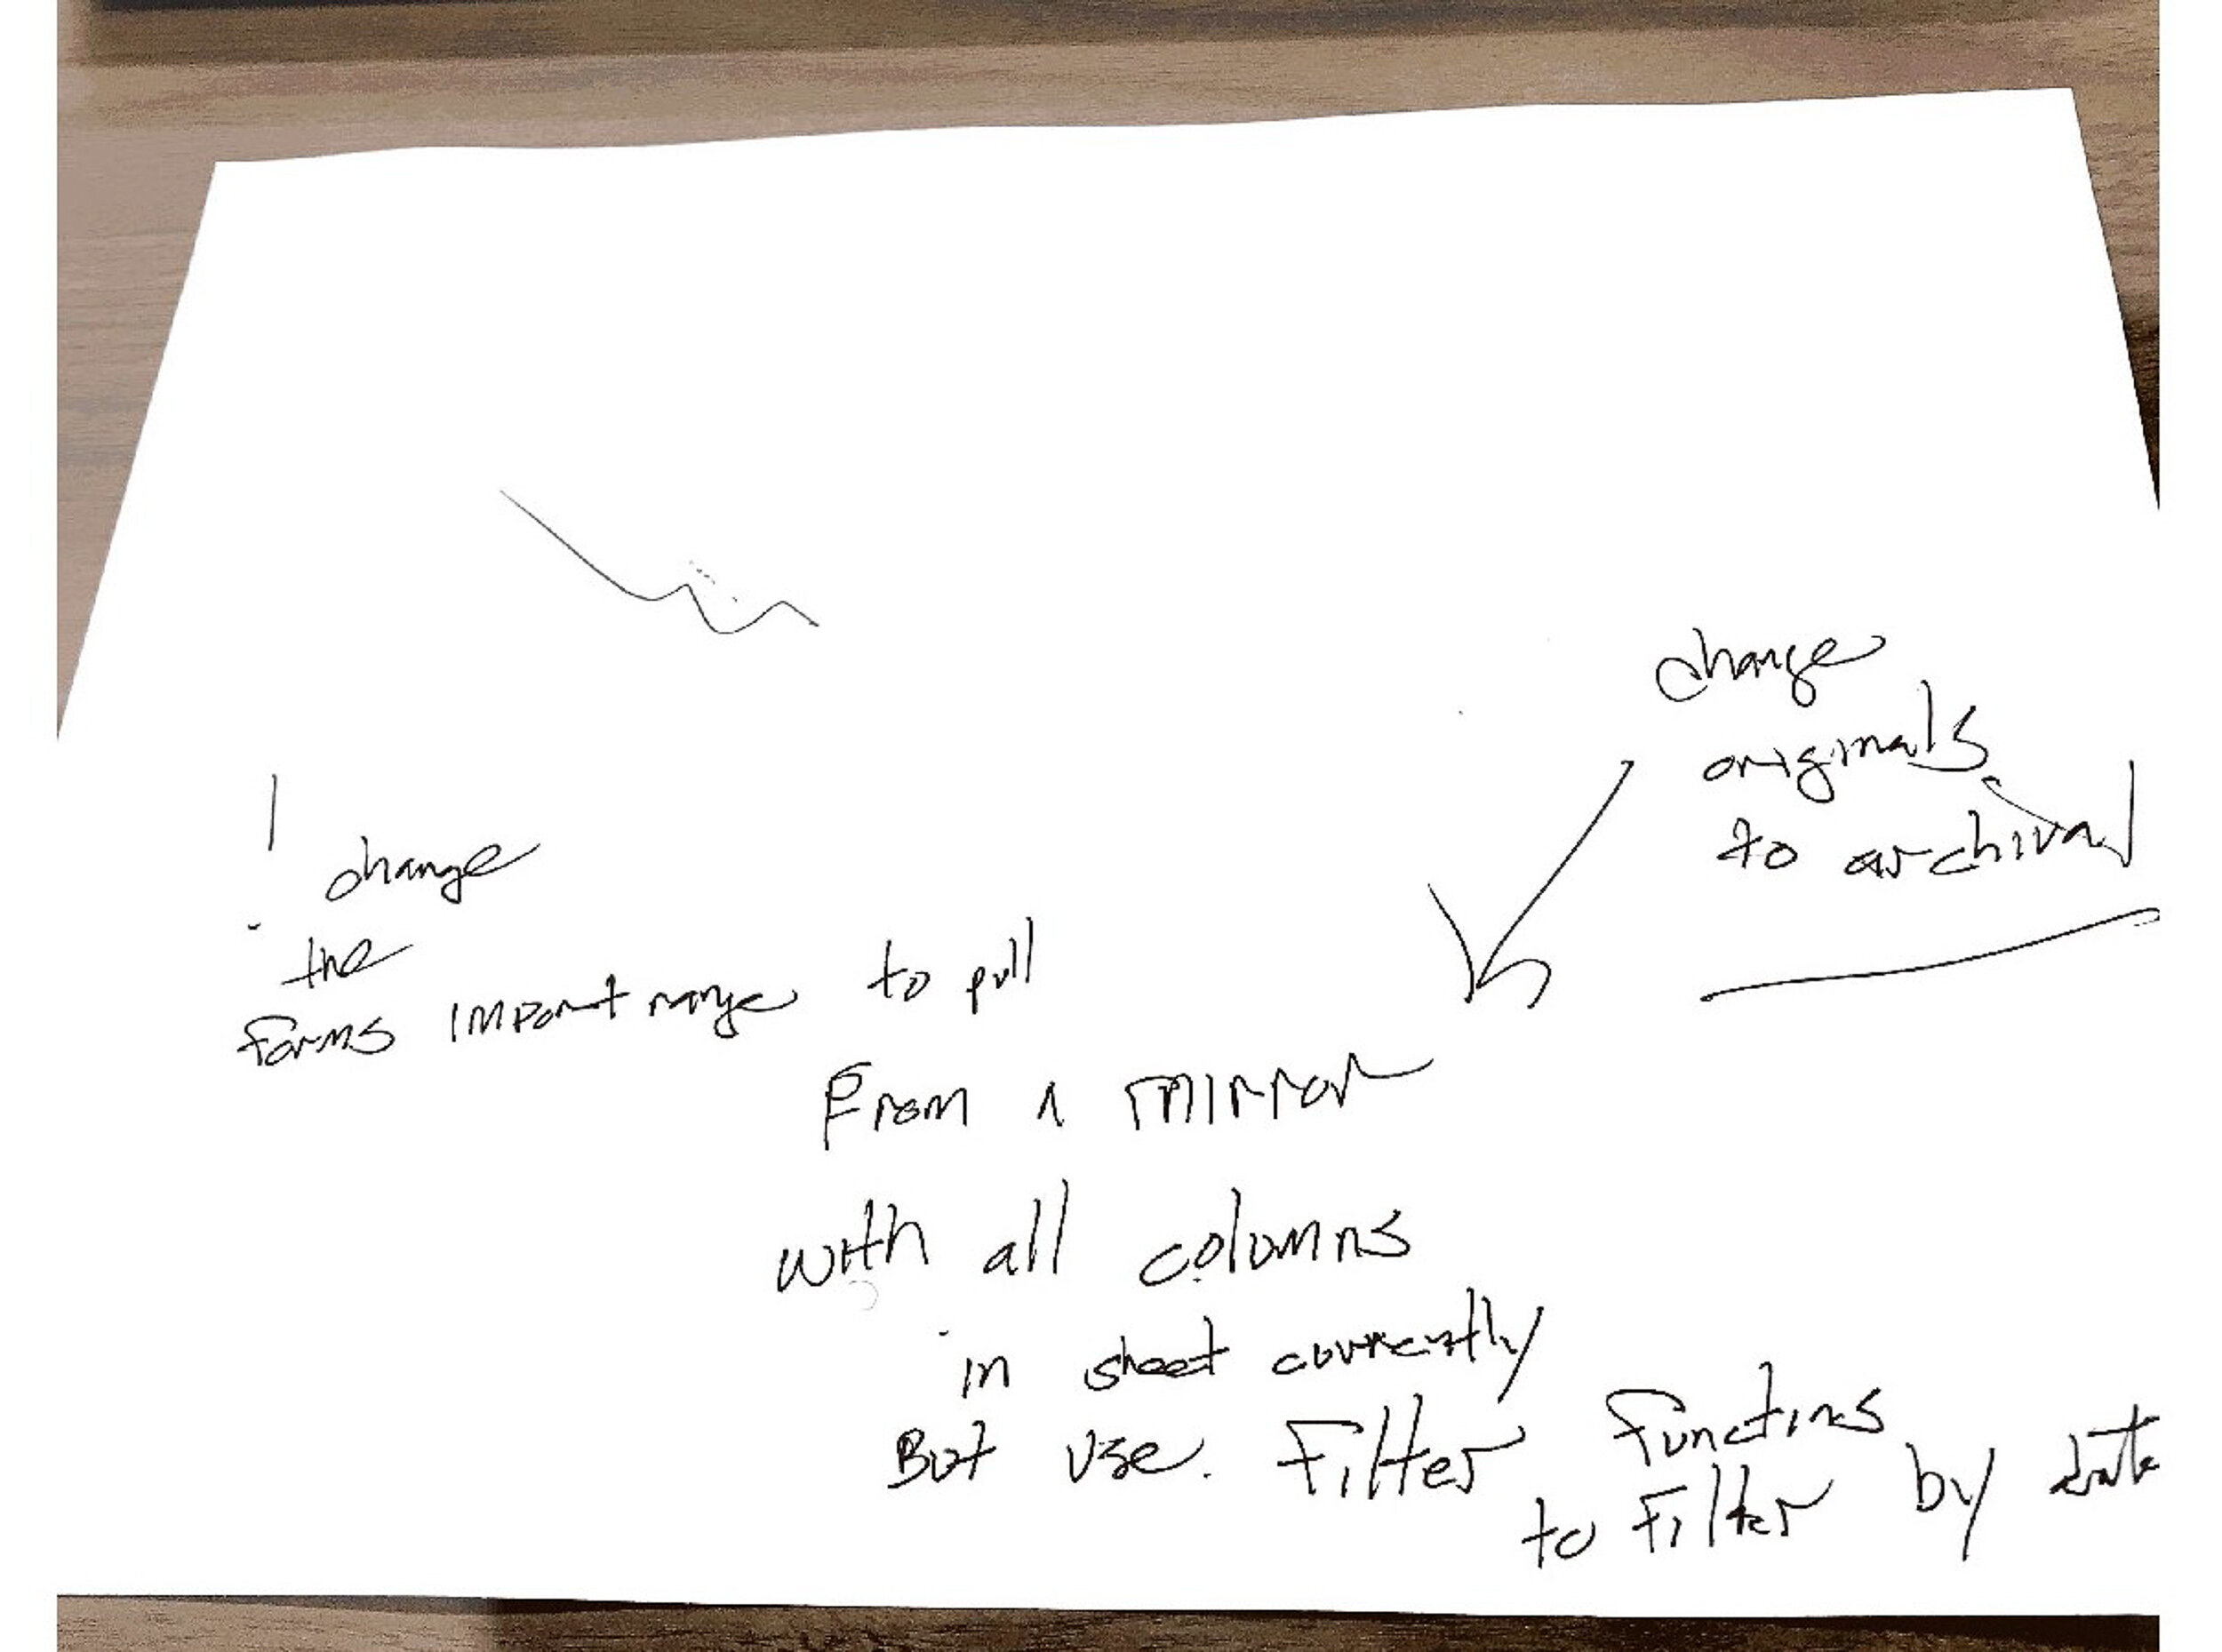
Step 3 - Prep Data
To complete this step, I took the following actions:
I identified exactly what data needed to be displayed.
I identified sources for each of those data points.
I exported that data from school information systems (or requested a data export from an outside source).
I cleaned up and organized the data exports.
I compiled the data into Google Sheets.

Harlem Link Data Suite - Academics: Step 3
Step 3 - Prep Data
To complete this step, I took the following actions:
I identified exactly what data needed to be displayed.
I identified sources for each of those data points.
I exported that data from school information systems (or requested a data export from an outside source).
I cleaned up and organized the data exports.
I compiled the data into Google Sheets.

Case Study 017. Harlem Link Data Suite - Academics: Step 4
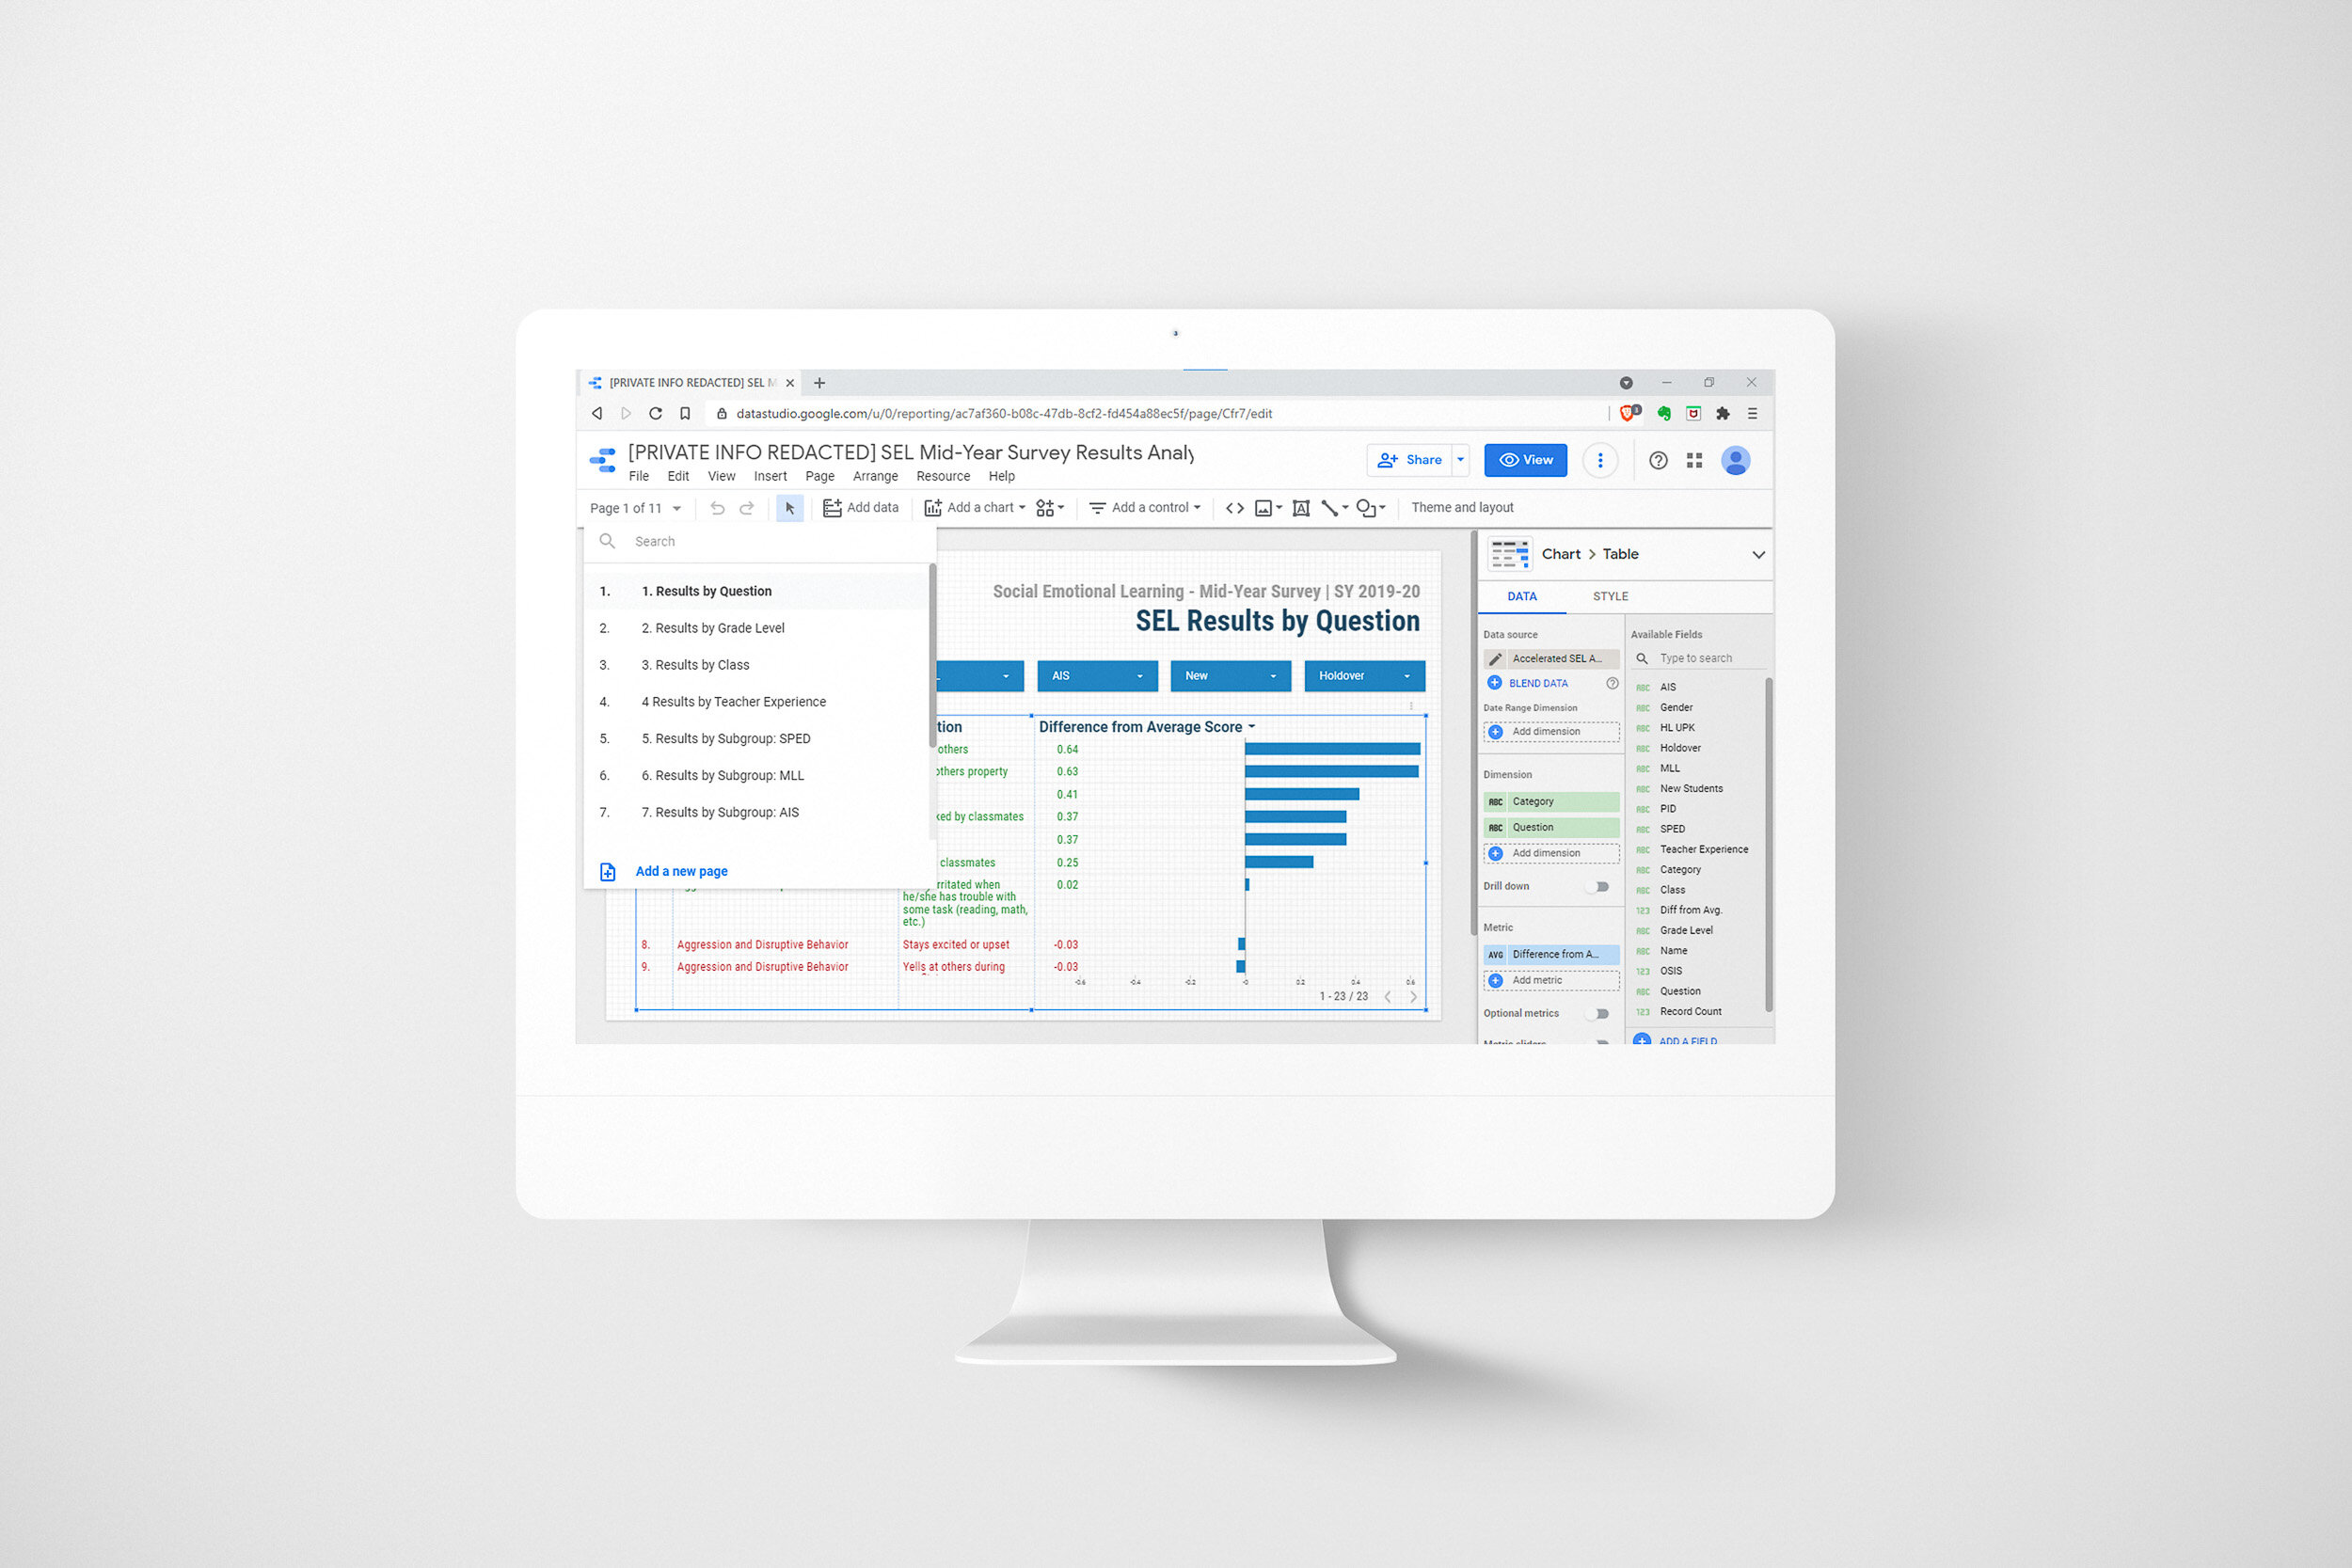
Step 4 - Build
Next, I took the Google Sheets datasources I’d just compiled and I connected them to Google Data Studio. I began to build out the reports inside of Data Studio.

Harlem Link Data Suite - Academics: Step 4
Step 4 - Build
Next, I took the Google Sheets datasources I’d just compiled and I connected them to Google Data Studio. I began to build out the reports inside of Data Studio.

Case Study 017. Harlem Link Data Suite - Academics: Step 5
Step 5 - Publish
I published the finished reports to the cloud using Google Data Studio and I shared them with all stakeholders. Since the documents were based online, all members of the team could review the data prior to their team meetings and arrive prepared to contribute to the group discussion.

Harlem Link Data Suite - Academics: Step 5
Step 5 - Publish
I published the finished reports to the cloud using Google Data Studio and I shared them with all stakeholders. Since the documents were based online, all members of the team could review the data prior to their team meetings and arrive prepared to contribute to the group discussion.
Case Study 016. Harlem Link Data Suite - Social Emotional Learning: Step 1
Step 1 - Discovery
To begin the process of creating the data report, I met with the school’s teachers and administrators. I listened to the concerns they had and the challenges they were facing. I began to form an idea of what information needed to be included in the final report and what raw data needed to be gathered.

Harlem Link Data Suite - Social Emotional Learning: Step 1
Step 1 - Discovery
To begin the process of creating the data report, I met with the school’s teachers and administrators. I listened to the concerns they had and the challenges they were facing. I began to form an idea of what information needed to be included in the final report and what raw data needed to be gathered.

Case Study 016. Harlem Link Data Suite - Social Emotional Learning: Step 2
Step 2 - Sketch
Next, I made a rough sketch of what the reports would look like and what information would go where on the screen.

Harlem Link Data Suite - Social Emotional Learning: Step 2
Step 2 - Sketch
Next, I made a rough sketch of what the reports would look like and what information would go where on the screen.

Case Study 016. Harlem Link Data Suite - Social Emotional Learning: Step 3
Step 3 - Prep Data
To complete this step, I took the following actions:
I identified exactly what data needed to be displayed.
I identified sources for each of those data points.
I exported that data from school information systems (or requested a data export from an outside source).
I cleaned up and organized the data exports.
I compiled the data into Google Sheets.

Harlem Link Data Suite - Social Emotional Learning: Step 3
Step 3 - Prep Data
To complete this step, I took the following actions:
I identified exactly what data needed to be displayed.
I identified sources for each of those data points.
I exported that data from school information systems (or requested a data export from an outside source).
I cleaned up and organized the data exports.
I compiled the data into Google Sheets.

Case Study 016. Harlem Link Data Suite - Social Emotional Learning: Step 4
Step 4 - Build
Next, I took the Google Sheets datasources I’d just compiled and I connected them to Google Data Studio. I began to build out the report inside of Data Studio.
Harlem Link Data Suite - Social Emotional Learning: Step 4
Step 4 - Build
Next, I took the Google Sheets datasources I’d just compiled and I connected them to Google Data Studio. I began to build out the report inside of Data Studio.

Case Study 016. Harlem Link Data Suite - Social Emotional Learning: Step 5
Step 5 - Publish
I published the finished report to the cloud using Google Data Studio and I shared them with all stakeholders. Since the document was based online, all members of the team could review the data prior to the data meeting and arrive prepared to contribute to the group discussion.

Harlem Link Data Suite - Social Emotional Learning: Step 5
Step 5 - Publish
I published the finished report to the cloud using Google Data Studio and I shared them with all stakeholders. Since the document was based online, all members of the team could review the data prior to the data meeting and arrive prepared to contribute to the group discussion.

Case Study 015. Harlem Link Data Suite - School Operations: Step 1
Step 1 - Discovery
To begin the process of creating the data reports, I met with the school’s teachers and administrators. I listened to the concerns they had and the challenges they were facing. I began to form an idea of what information needed to be included in the data reports and what raw data needed to be gathered.
Harlem Link Data Suite - School Operations: Step 1
Step 1 - Discovery
To begin the process of creating the data reports, I met with the school’s teachers and administrators. I listened to the concerns they had and the challenges they were facing. I began to form an idea of what information needed to be included in the data reports and what raw data needed to be gathered.

Case Study 015. Harlem Link Data Suite - School Operations: Step 2
Step 2 - Sketch
Next, I made a rough sketch of what the reports would look like and what information would go where on the screen.

Harlem Link Data Suite - School Operations: Step 2
Step 2 - Sketch
Next, I made a rough sketch of what the reports would look like and what information would go where on the screen.

Case Study 015. Harlem Link Data Suite - School Operations: Step 3
Step 3 - Prep Data
To complete this step, I took the following actions:
I identified exactly what data needed to be displayed.
I identified sources for each of those data points.
I exported that data from school information systems (or requested a data export from an outside source).
I cleaned up and organized the data exports.
I compiled the data into Google Sheets.

Harlem Link Data Suite - School Operations: Step 3
Step 3 - Prep Data
To complete this step, I took the following actions:
I identified exactly what data needed to be displayed.
I identified sources for each of those data points.
I exported that data from school information systems (or requested a data export from an outside source).
I cleaned up and organized the data exports.
I compiled the data into Google Sheets.

Case Study 015. Harlem Link Data Suite - School Operations: Step 4
Step 4 - Build
Next, I took the Google Sheets datasources I’d just compiled and I connected them to Google Data Studio. I began to build out the reports inside of Data Studio.

Harlem Link Data Suite - School Operations: Step 4
Step 4 - Build
Next, I took the Google Sheets datasources I’d just compiled and I connected them to Google Data Studio. I began to build out the reports inside of Data Studio.

Case Study 015. Harlem Link Data Suite - School Operations: Step 5
Step 5 - Publish
I published the finished reports to the cloud using Google Data Studio and I shared them with all stakeholders. Since the documents were based online, all members of the team could access them throughout the day whenever they needed to.

Harlem Link Data Suite - School Operations: Step 5
Step 5 - Publish
I published the finished reports to the cloud using Google Data Studio and I shared them with all stakeholders. Since the documents were based online, all members of the team could access them throughout the day whenever they needed to.