Case Study 020. Tuition Assistance Program Infographic: Step 1
Step 1 - Discovery
My very first step was to gather all of the information I had and flesh out my ideas for what the infographic would communicate.
Step 1 - Discovery
My very first step was to gather all of the information I had and flesh out my ideas for what the infographic would communicate.
Case Study 020. Tuition Assistance Program Infographic: Step 2
Step 2 - Sketch
Next, I made a rough sketch of what the infographic would look like and what information would go where. I used a grid structure so my design would look balanced and well-organized.
Step 2 - Sketch
Next, I made a rough sketch of what the infographic would look like and what information would go where. I used a grid structure so my design would look balanced and well-organized.
Case Study 020. Tuition Assistance Program Infographic: Step 3
Step 3 - Prep Data
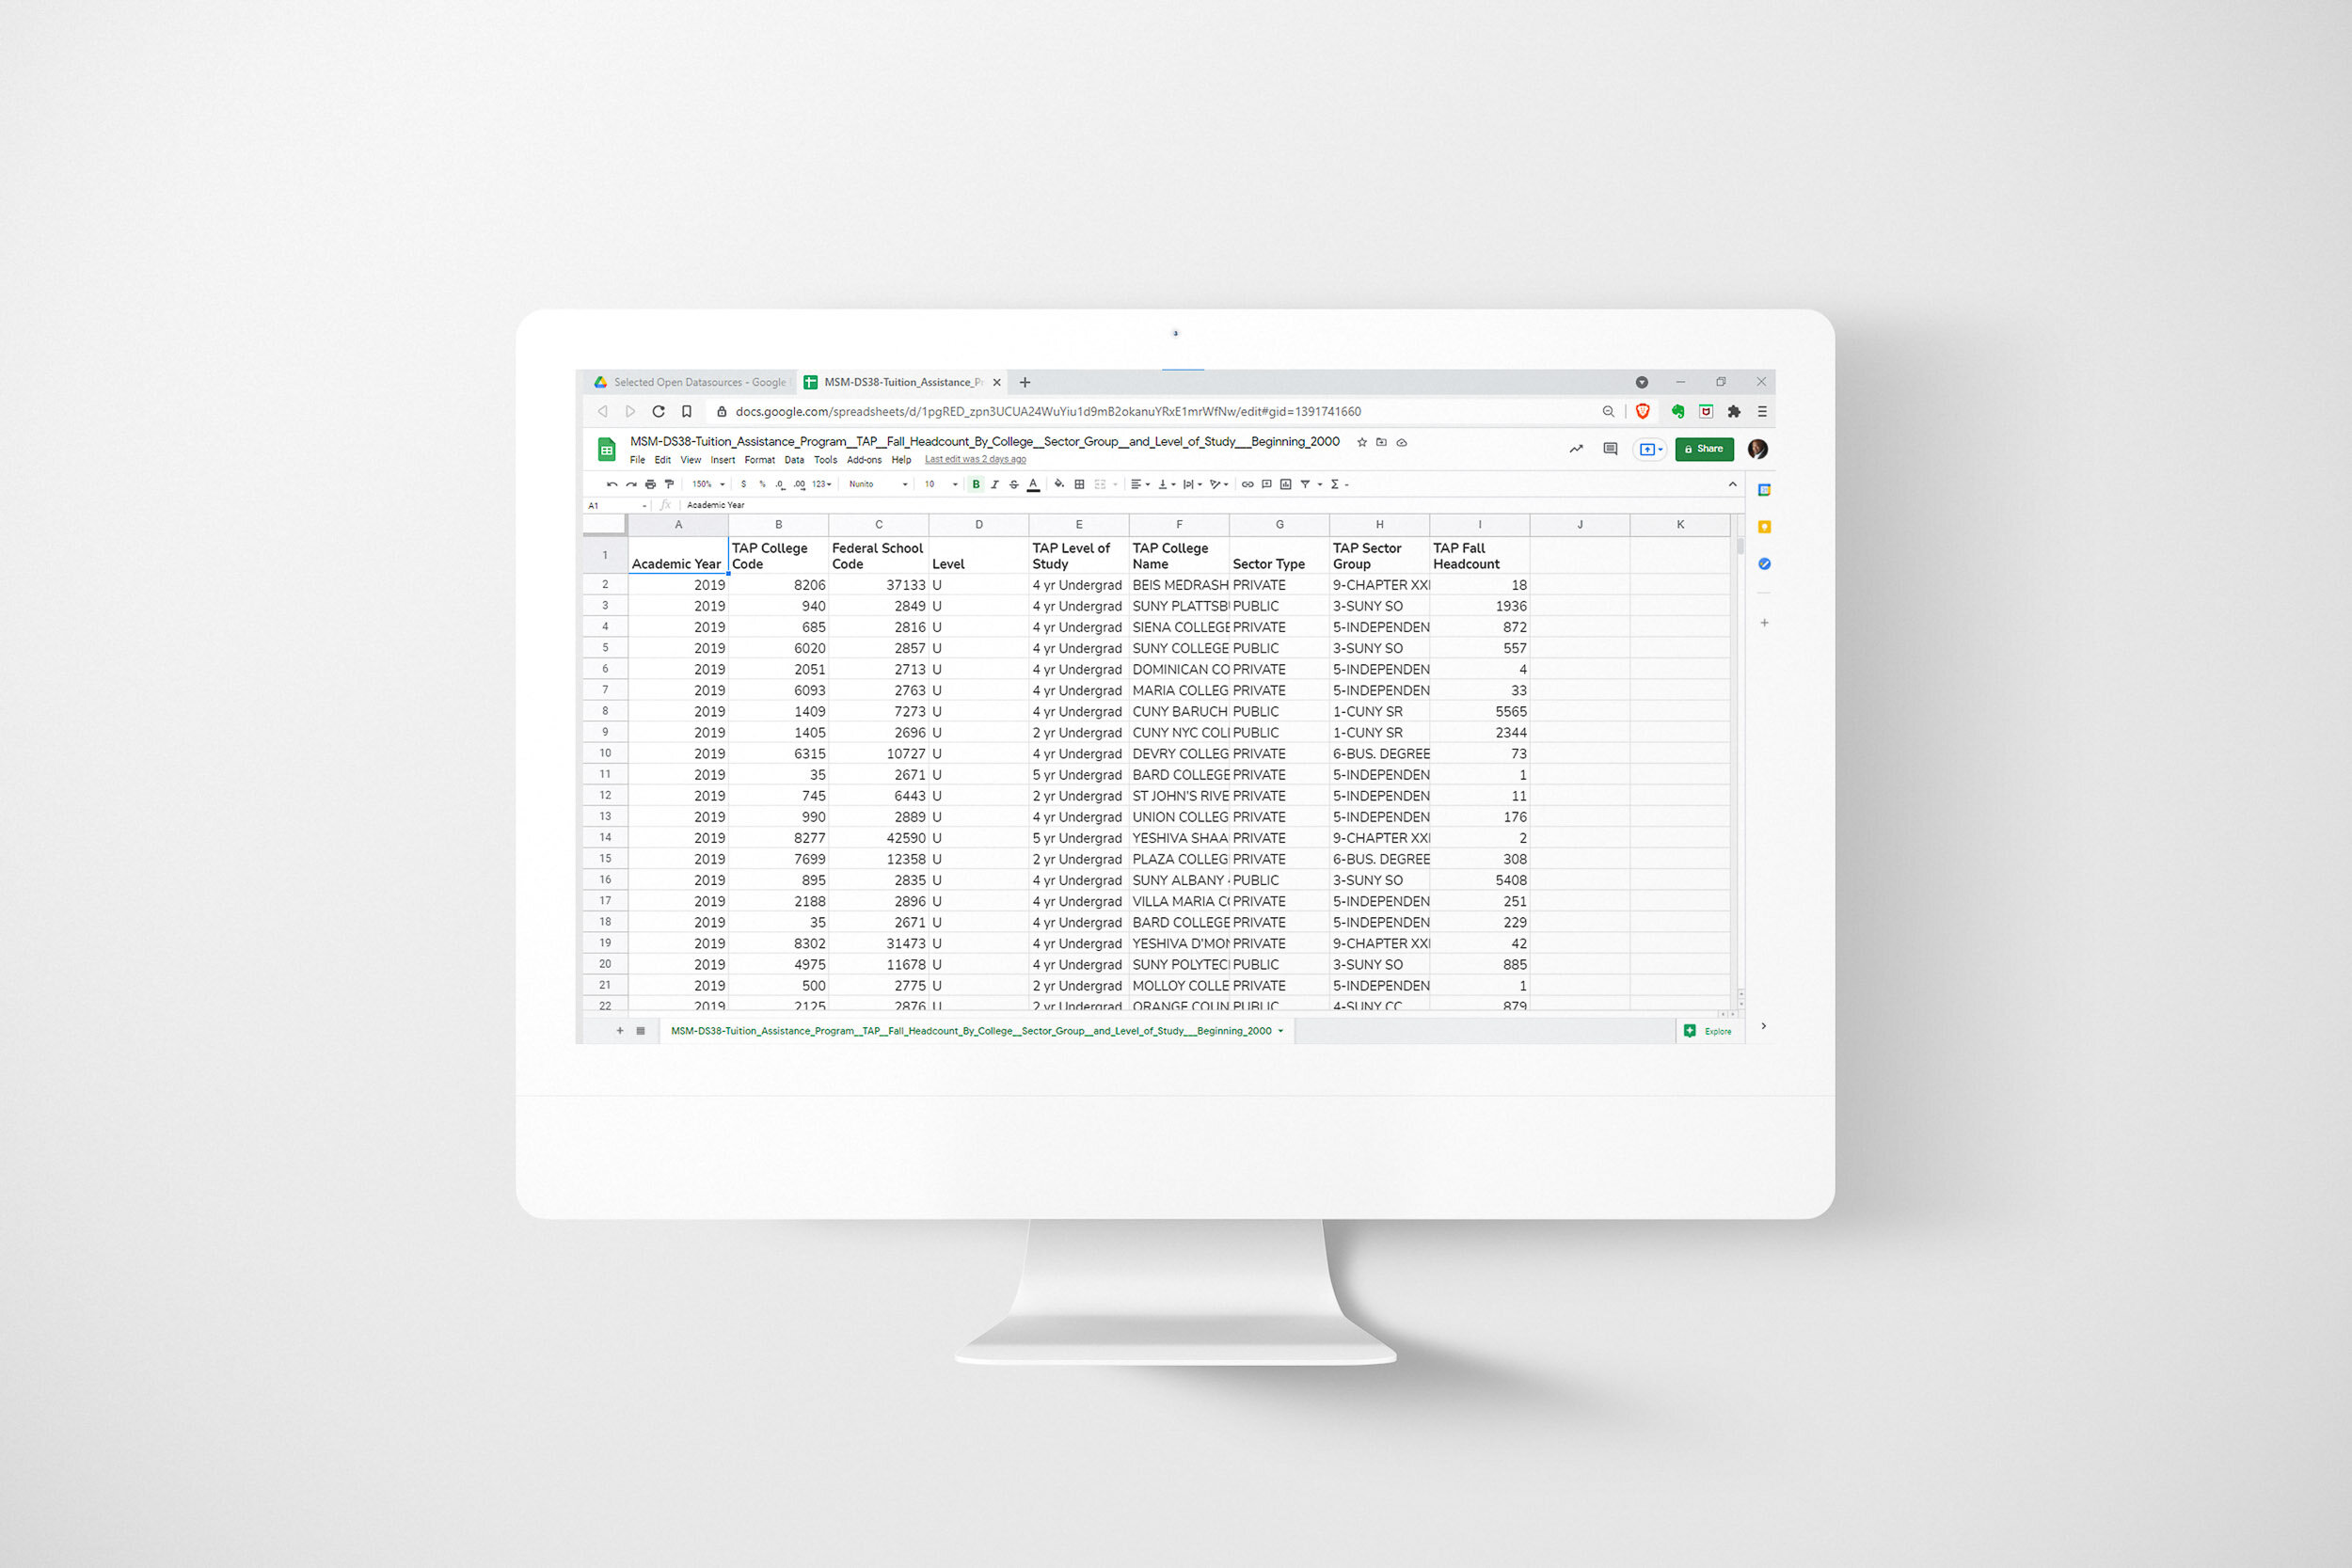
I located the financial aid data file on data.gov and downloaded it to my computer. I then uploaded it to my GitHub repository so I would be able to access it from any computer and others could easily access the data once my work was published.
Step 3 - Prep Data
I located the financial aid data file on data.gov and downloaded it to my computer. I then uploaded it to my GitHub repository so I would be able to access it from any computer and others could easily access the data once my work was published.
Case Study 020. Tuition Assistance Program Infographic: Step 4
Step 4 - Build
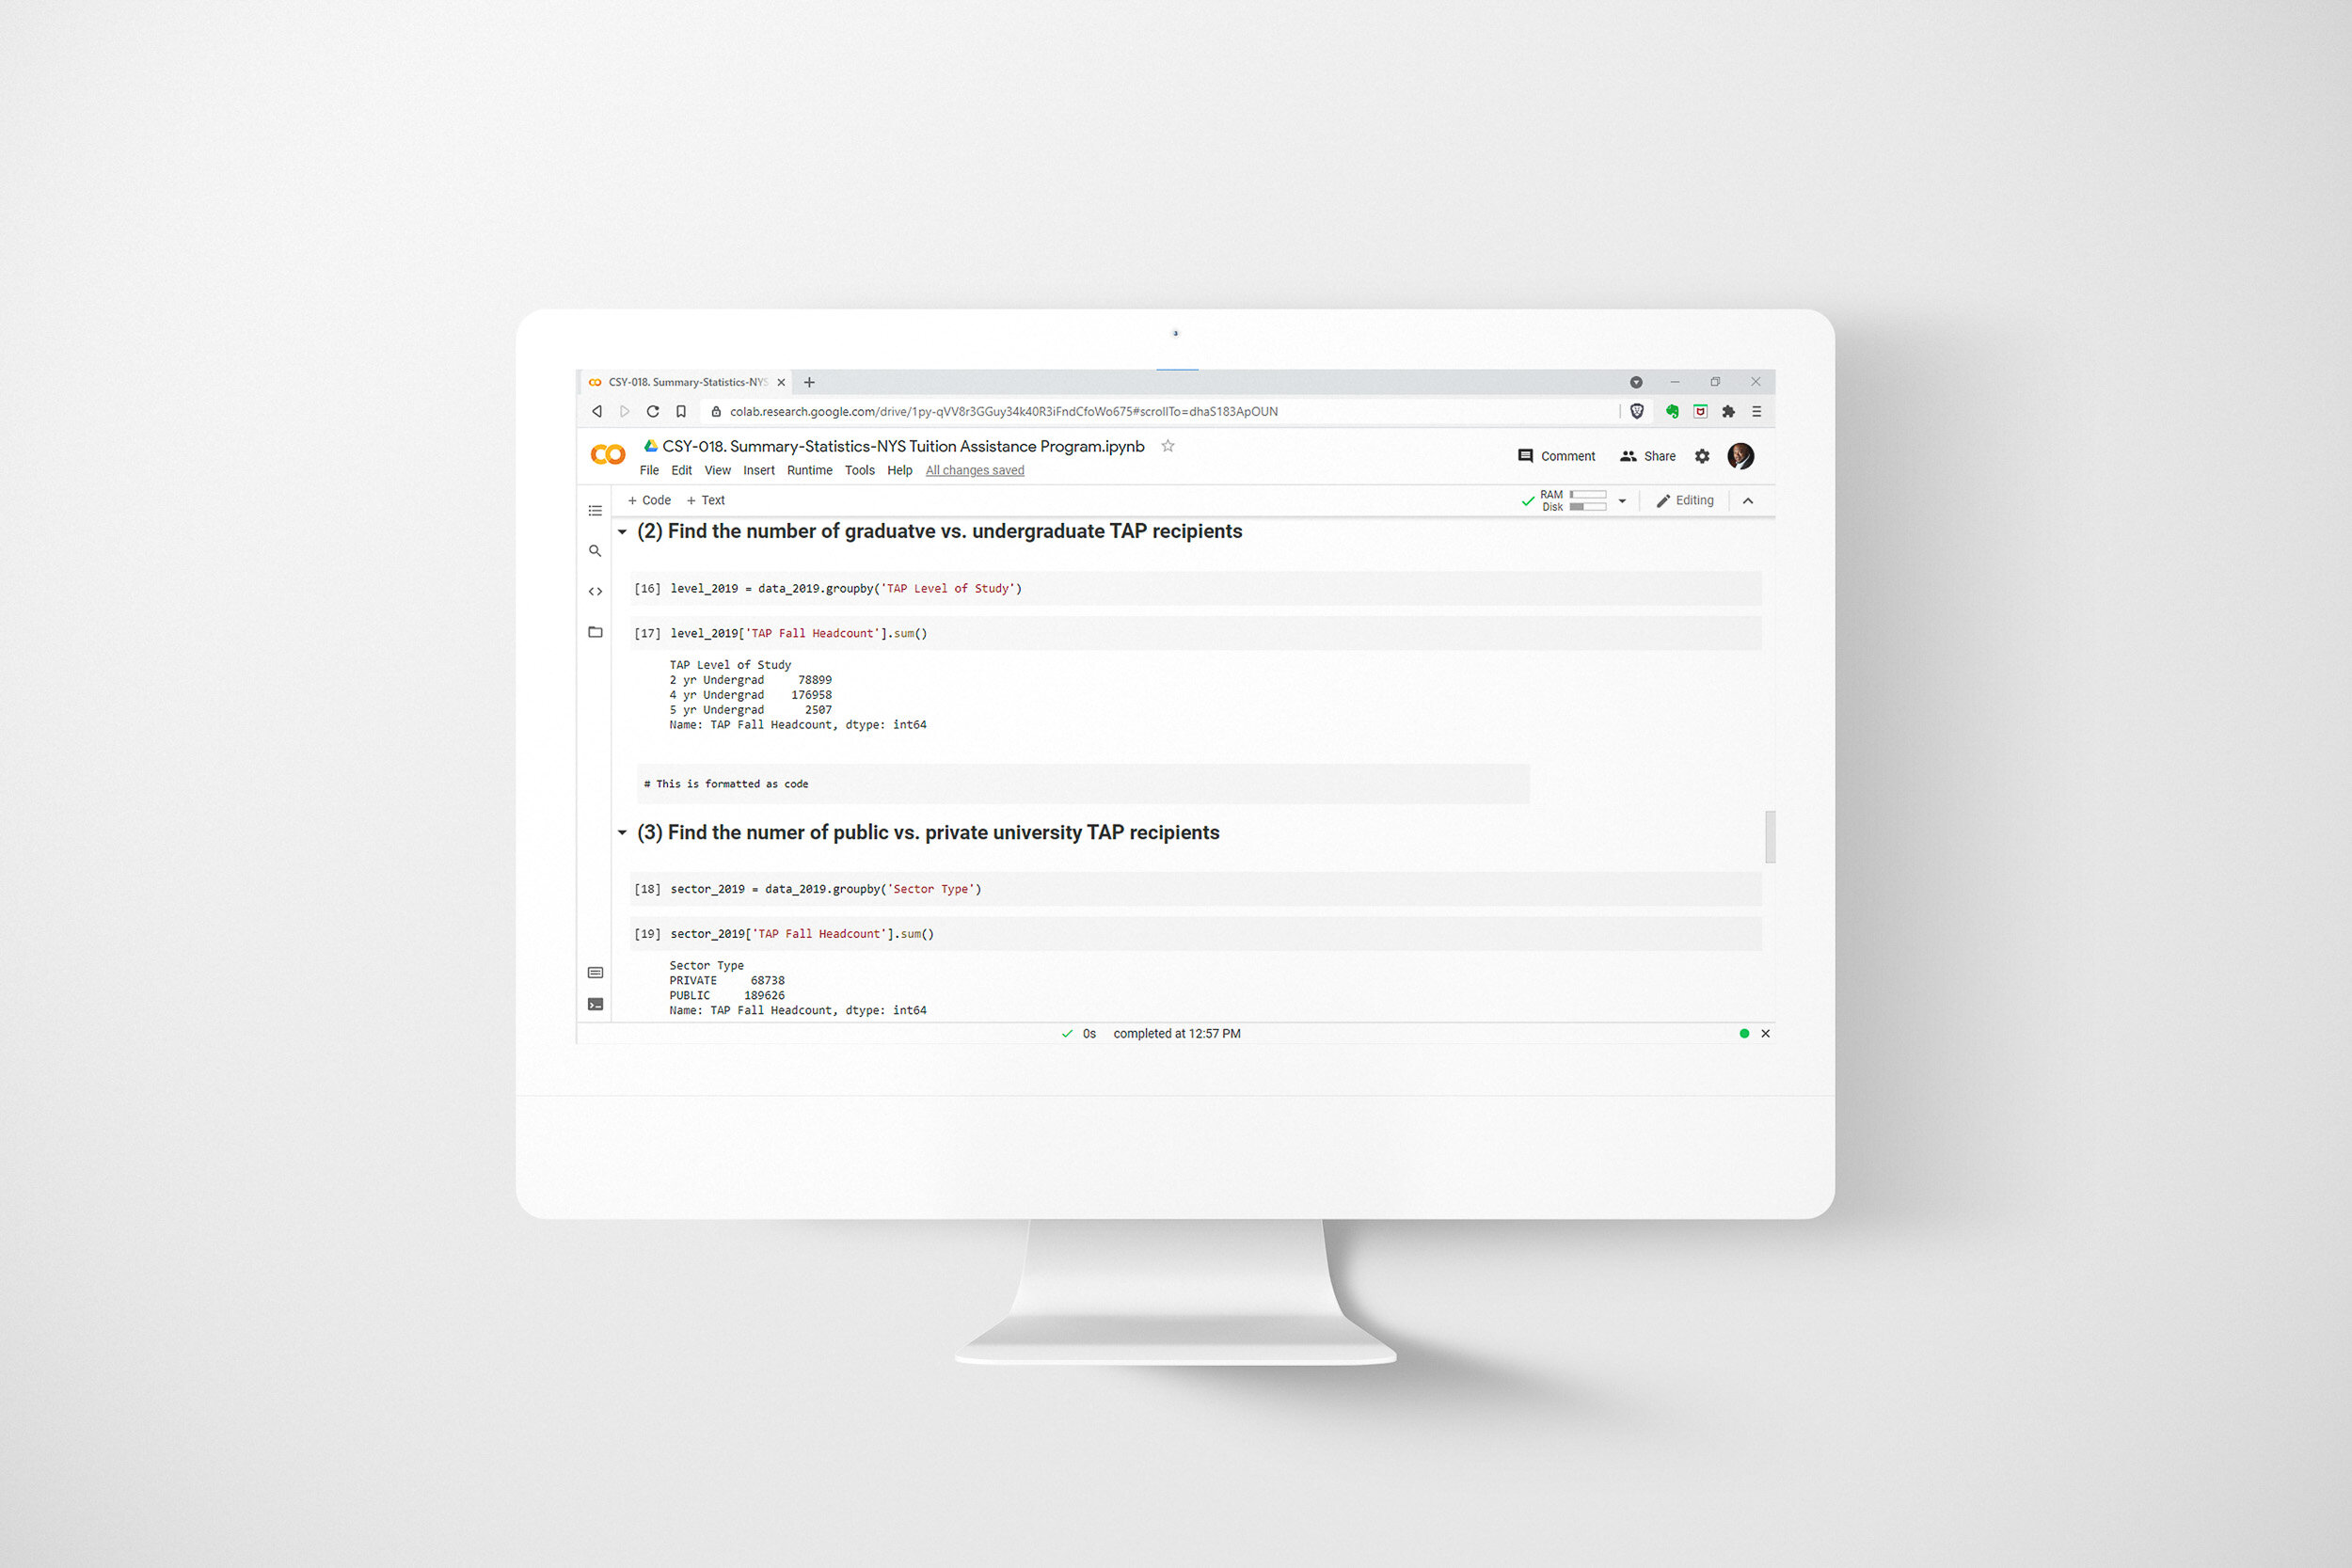
I calculated summary statistics using Python code and Google Colab. I chose Python because Python is capable of processing a large volume of data quickly and efficiently.
Step 4 - Build
I calculated summary statistics using Python code and Google Colab. I chose Python because Python is capable of processing a large volume of data quickly and efficiently.
Case Study 020. Tuition Assistance Program Infographic: Step 5
Step 5 - Publish
Finally, I created the graphic using Adobe Illustrator. Once finished, I exported the file in PNG format (image) and PDF format (document). Either format can easily be printed, shared via email or hosted online.
Step 5 - Publish
Finally, I created the graphic using Adobe Illustrator. Once finished, I exported the file in PNG format (image) and PDF format (document). Either format can easily be printed, shared via email or hosted online.
Case Study 014. Exploratory Data Analysis: Pre-Work
Pre-Work
In this exploratory data analysis I explored a dataset of information on public schools in the United States. The underlying data was made freely available to the public and I obtained it from the U.S. Department of Education website.
Pre-Work
In this exploratory data analysis I explored a dataset of information on public schools in the United States. The underlying data was made freely available to the public and I obtained it from the U.S. Department of Education website.
Case Study 014. Exploratory Data Analysis: Step 1
Step 1 - Prepare the Workspace
Since I was working with a fairly large dataset, I decided that Python was the best tool to use to analyze it. I used a Jupyter Notebook to run my code.
Step 1 - Prepare the Workspace
Since I was working with a fairly large dataset, I decided that Python was the best tool to use to analyze it. I used a Jupyter Notebook to run my code.
Case Study 014. Exploratory Data Analysis: Step 2
Step 2 - Describe the Characteristics of the Dataset
First, I wanted to wrap my head around the dataset by finding out exactly what size it was and specifically what kind of information (variables) it contained.
Step 2 - Describe the Characteristics of the Dataset
First, I wanted to wrap my head around the dataset by finding out exactly what size it was and specifically what kind of information (variables) it contained.
Case Study 014. Exploratory Data Analysis: Step 3
Step 3 - Summarize the Dataset
Next, I did some basic calculations to produce a set of summary statistics.
Step 3 - Summarize the Dataset
Next, I did some basic calculations to produce a set of summary statistics.
Case Study 014. Exploratory Data Analysis: Step 4
Step 4 - Visualize the Dataset
Then, I made a number of visualizations that helped me to better understand what the data was saying.
Step 4 - Visualize the Dataset
Then, I made a number of visualizations that helped me to better understand what the data was saying.
Case Study 014. Exploratory Data Analysis: Step 5
Step 5 - Identify Insights
Finally, I could draw some insights from the dataset. Here are the main takeaways:
The dataset consists of 51 rows and 42 columns
The dataset consists of:
student enrollment
school staffing
student demographic information
There are 51 rows and 42 columns in the dataset. None of the rows are blank.
The dataset contains totals per state of the number of students in (2) gender categories and (7) race/ethnicity categories.
2018-19 US public school total enrollments by demographic group are as follows:
25.8 million male students
24.4 million female students
473K American Indian/Alaska Native students
2.6 million Asian or Asian/Pacific Islander students
13.7 million Hispanic students
7.6 million Black students
23.7 million White students
176K Hawaiian Nat./Pacific Isl. students
2 million multiracial students
The states with the highest number of Black public school students are: Florida, Georgia and Texas
The states with the highest number of Hispanic public school students are: California and Texas
The state with the highest number of Asian or Asian/Pacific Islander public school students is California. New York and Texas are a distant second and third.The states with the highest number of American Indian/Alaska Native public school students by far is OklahomaThe state with the highest number of Hawaiian/Pacific Islander public school students by far is HawaiiThe states with the highest number of White public school students are: California and Texas


