

Case Study 005. South Asian Youth Action (SAYA!) Weather vs. Attendance Tracker: Step 3
Step 3 - Prep Data
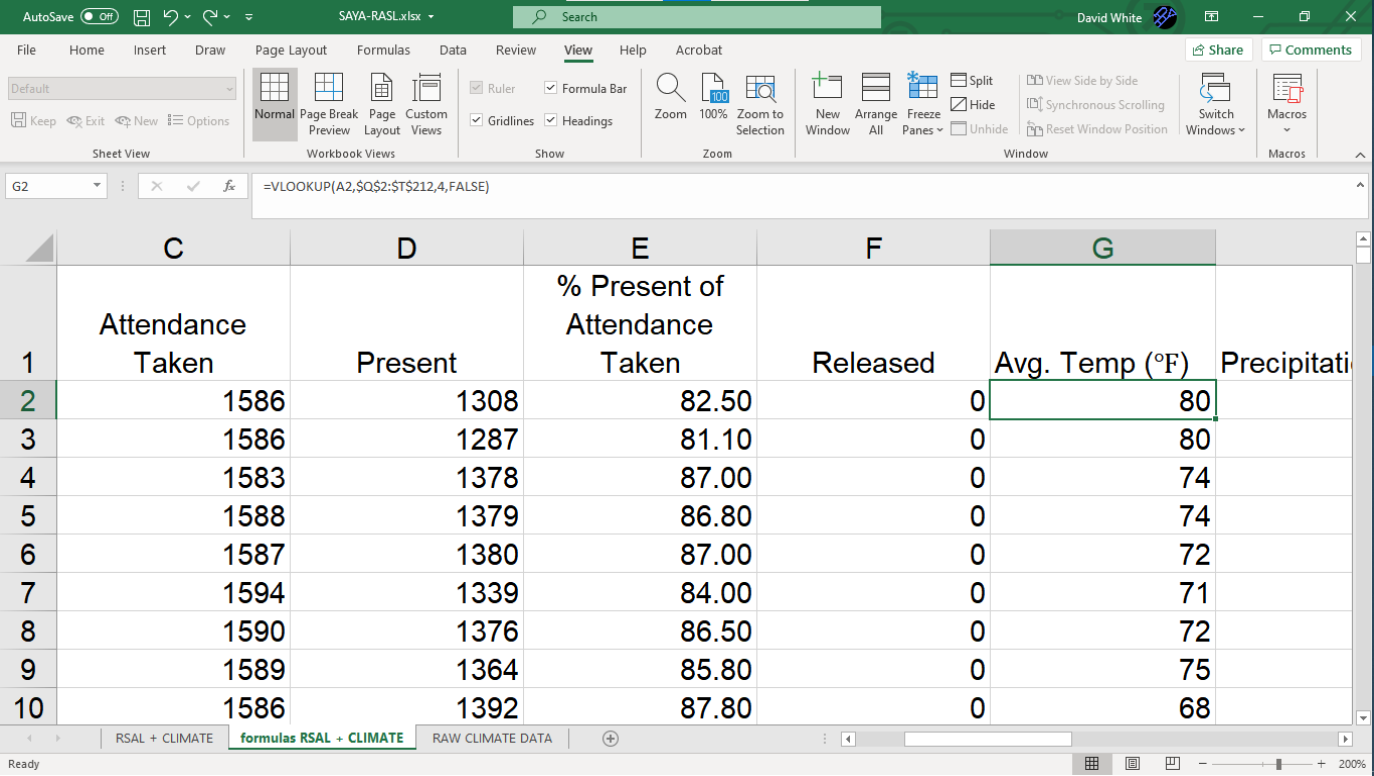
I collected the school’s attendance data and I joined it with local weather data published by the National Oceanic and Atmospheric Administration (NOAA). Then I lined up the daily attendance data with the NOAA weather data for that school day.
SAYA Attendance vs. Weather: Work Process Step 3 of 5
Step 3 - Prep Data
I collected the school’s attendance data and I joined it with local weather data published by the National Oceanic and Atmospheric Administration (NOAA). Then I lined up the daily attendance data with the NOAA weather data for that school day.
Case Study 004. South Asian Youth Action (SAYA!) Recent Trends in Absenteeism: Step 3
Step 3 - Prep Data
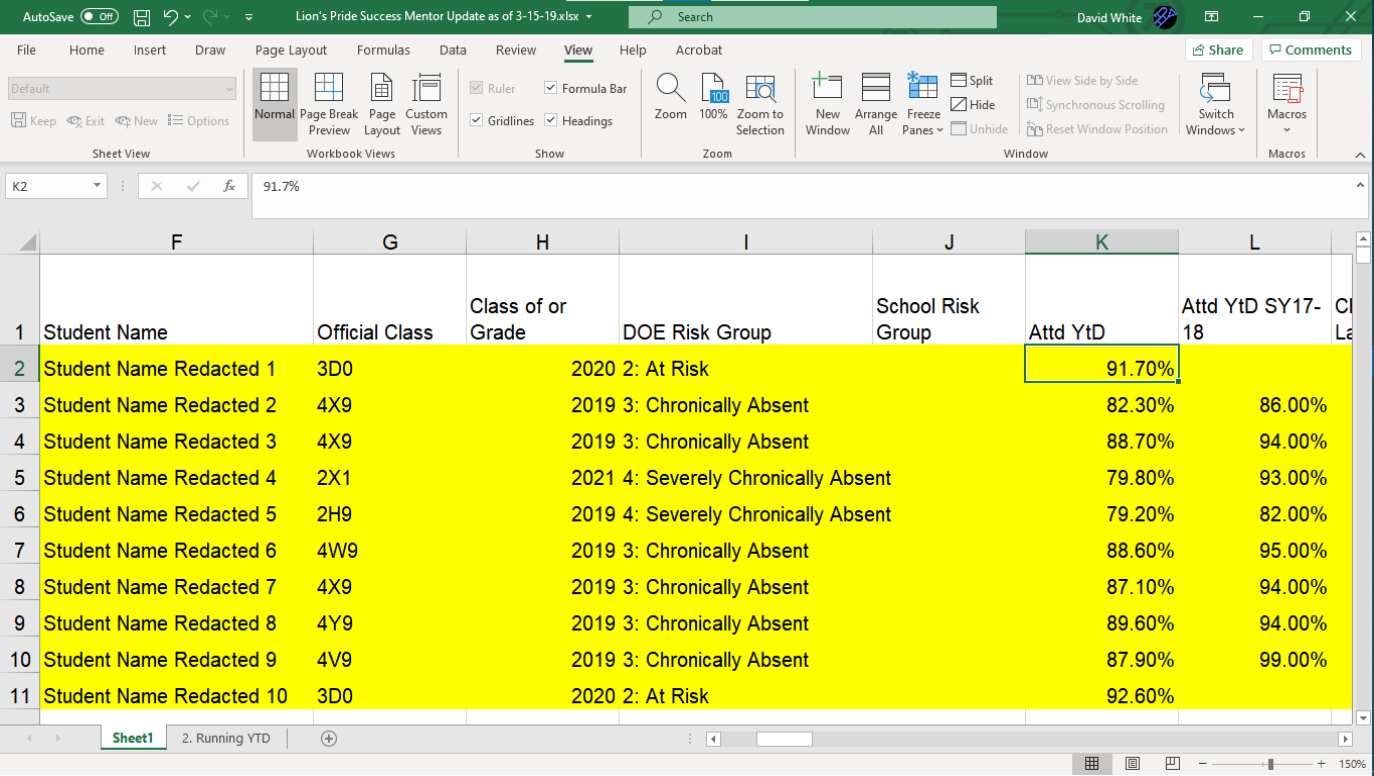
I collected the raw attendance and school enrollment data I needed and I organized it into a form that would allow it to translate smoothly into visuals.
SAYA Attendance Trends: Work Process Step 3 of 5
Step 3 - Prep Data
I collected the raw attendance and school enrollment data I needed and I organized it into a form that would allow it to translate smoothly into visuals.
Case Study 003. South Asian Youth Action (SAYA!) Attendance Tracker: Step 3
Step 3 - Prep Data
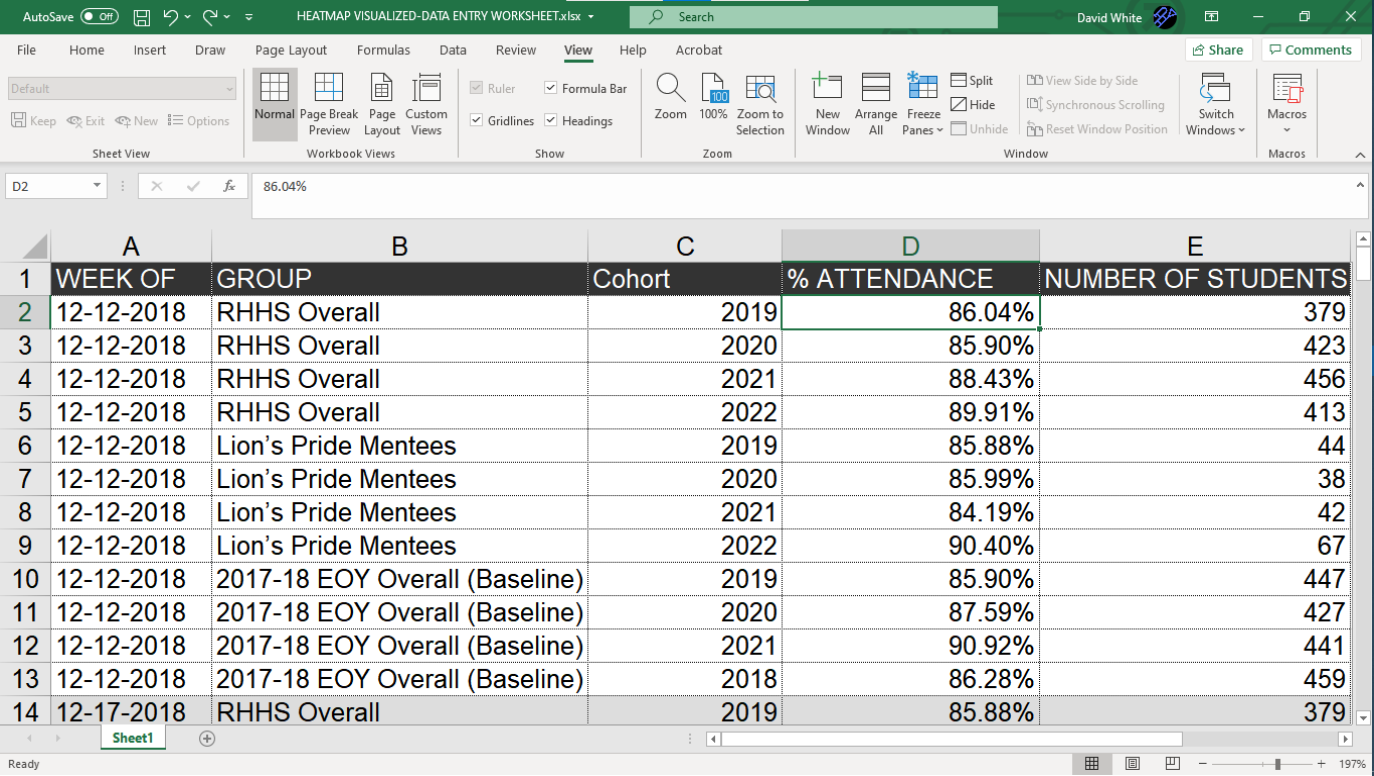
Since this was a visualization that would have to be updated on a weekly basis, I made sure to organize the data files in such a way that they could be updated quickly. I had to ensure that all of the columns for each category of data would line up exactly, every time. Also, since this would be a change-over-time visualization, it was important to make sure that the format for the date was exactly the same for every row of data. (In this case, I used “MM-DD-YYYY” format.)
SAYA Attendance Tracker: Work Process Step 3 of 5
Step 3 - Prep Data
Since this was a visualization that would have to be updated on a weekly basis, I made sure to organize the data files in such a way that they could be updated quickly. I had to ensure that all of the columns for each category of data would line up exactly, every time. Also, since this would be a change-over-time visualization, it was important to make sure that the format for the date was exactly the same for every row of data. (In this case, I used “MM-DD-YYYY” format.)

Case Study 002. GCCS Mock Exam Data Analysis Kit: Step 3
Step 3 - Prep Data
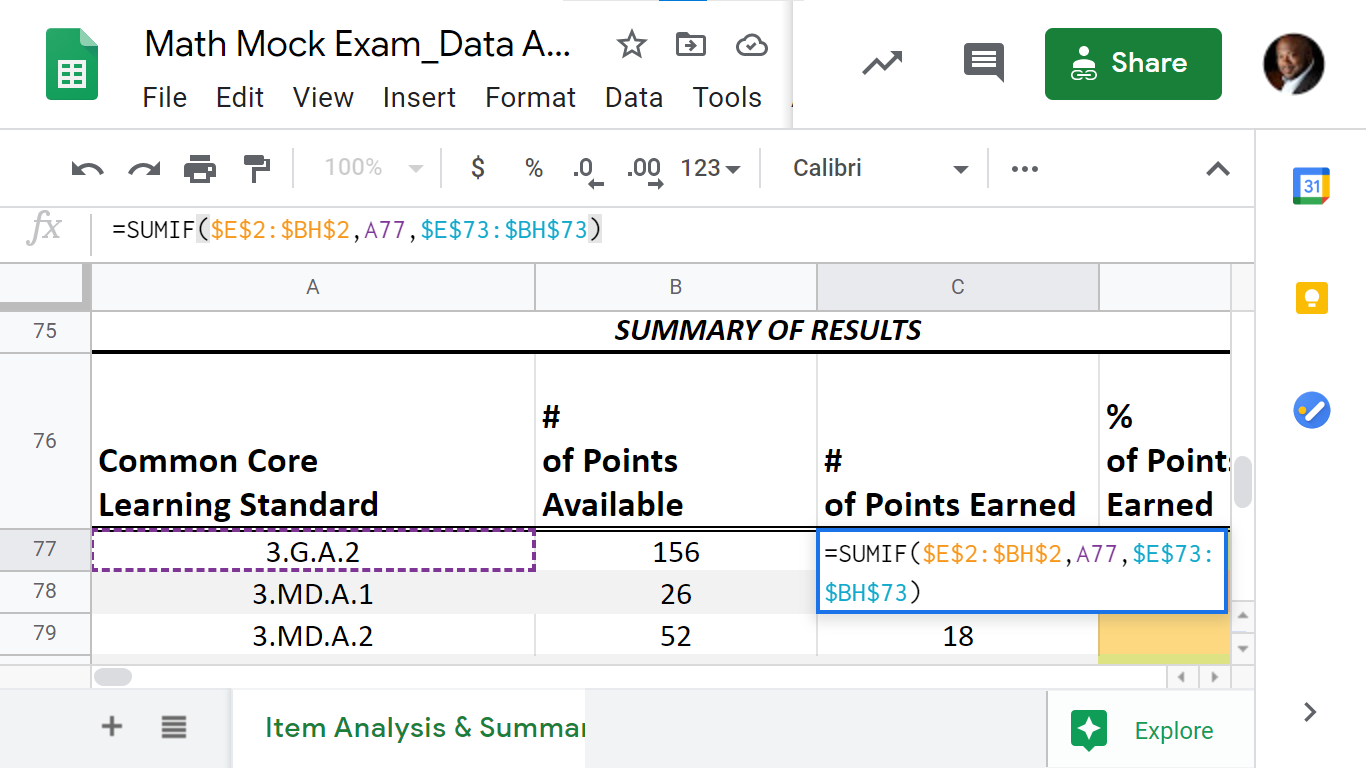
The data tool predicted the students’ performance on future exams. In order to accomplish this, I researched past state exams and mapped them to the material on the practice exams.
GCCS Data Analysis Kit: Work Process Step 3 of 5
Step 3 - Prep Data
The data tool predicted the students’ performance on future exams. In order to accomplish this, I researched past state exams and mapped them to the material on the practice exams.

Case Study 002. GCCS Mock Exam Data Analysis Kit: Step 4
Step 4 - Build
To build the tool, I used Microsoft Excel. I chose Excel because it was available to everyone in the organization and it was a tool that staff members were already familiar with and felt comfortable using.
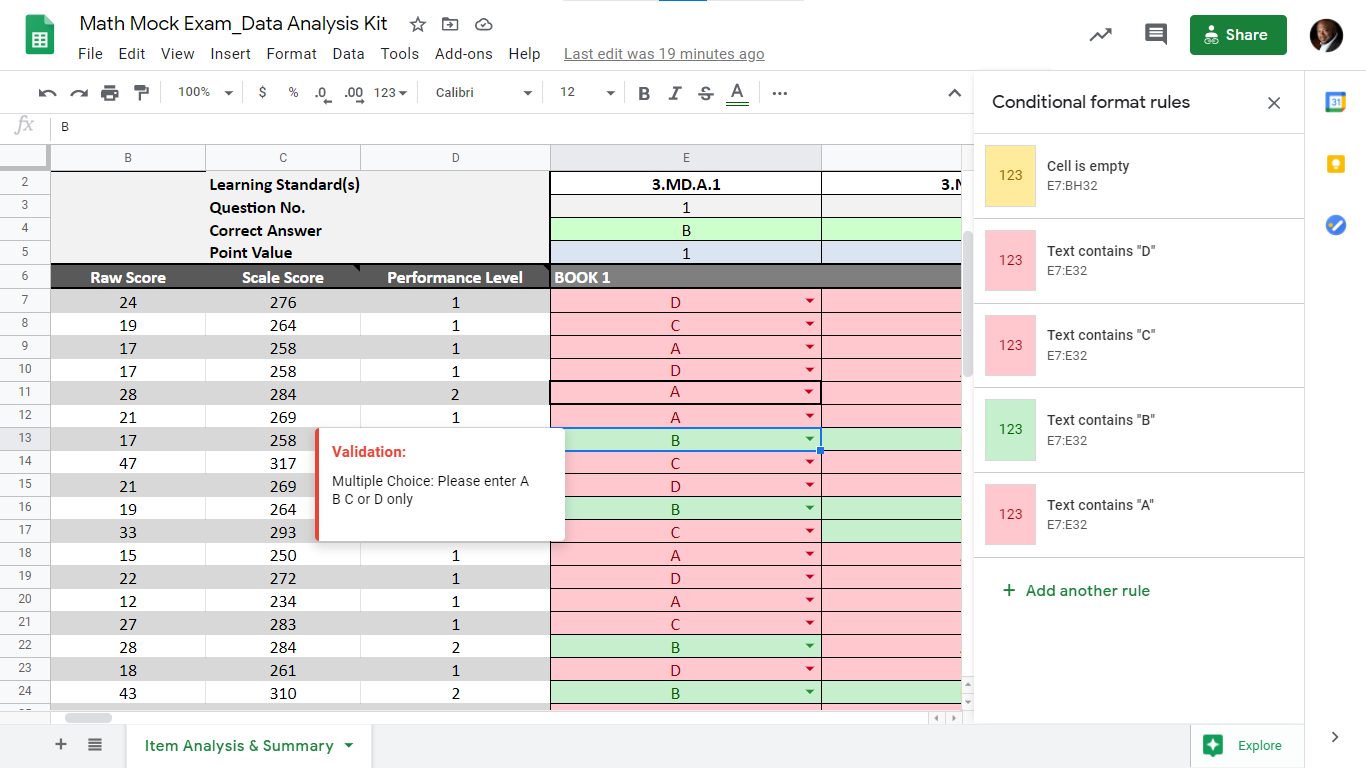
GCCS Data Analysis Kit: Work Process Step 4 of 5
Step 4 - Build
To build the tool, I used Microsoft Excel. I chose Excel because it was available to everyone in the organization and it was a tool that staff members were already familiar with and felt comfortable using.

Case Study 002. GCCS Mock Exam Data Analysis Kit: Step 5
Step 5 - Publish
I published the finished data kit on the school’s shared drive where all staff members could easily access it. The tool was used by teachers, school leaders and instructional coaches during their weekly meetings and it helped them with lesson planning and organizing small-group instruction.
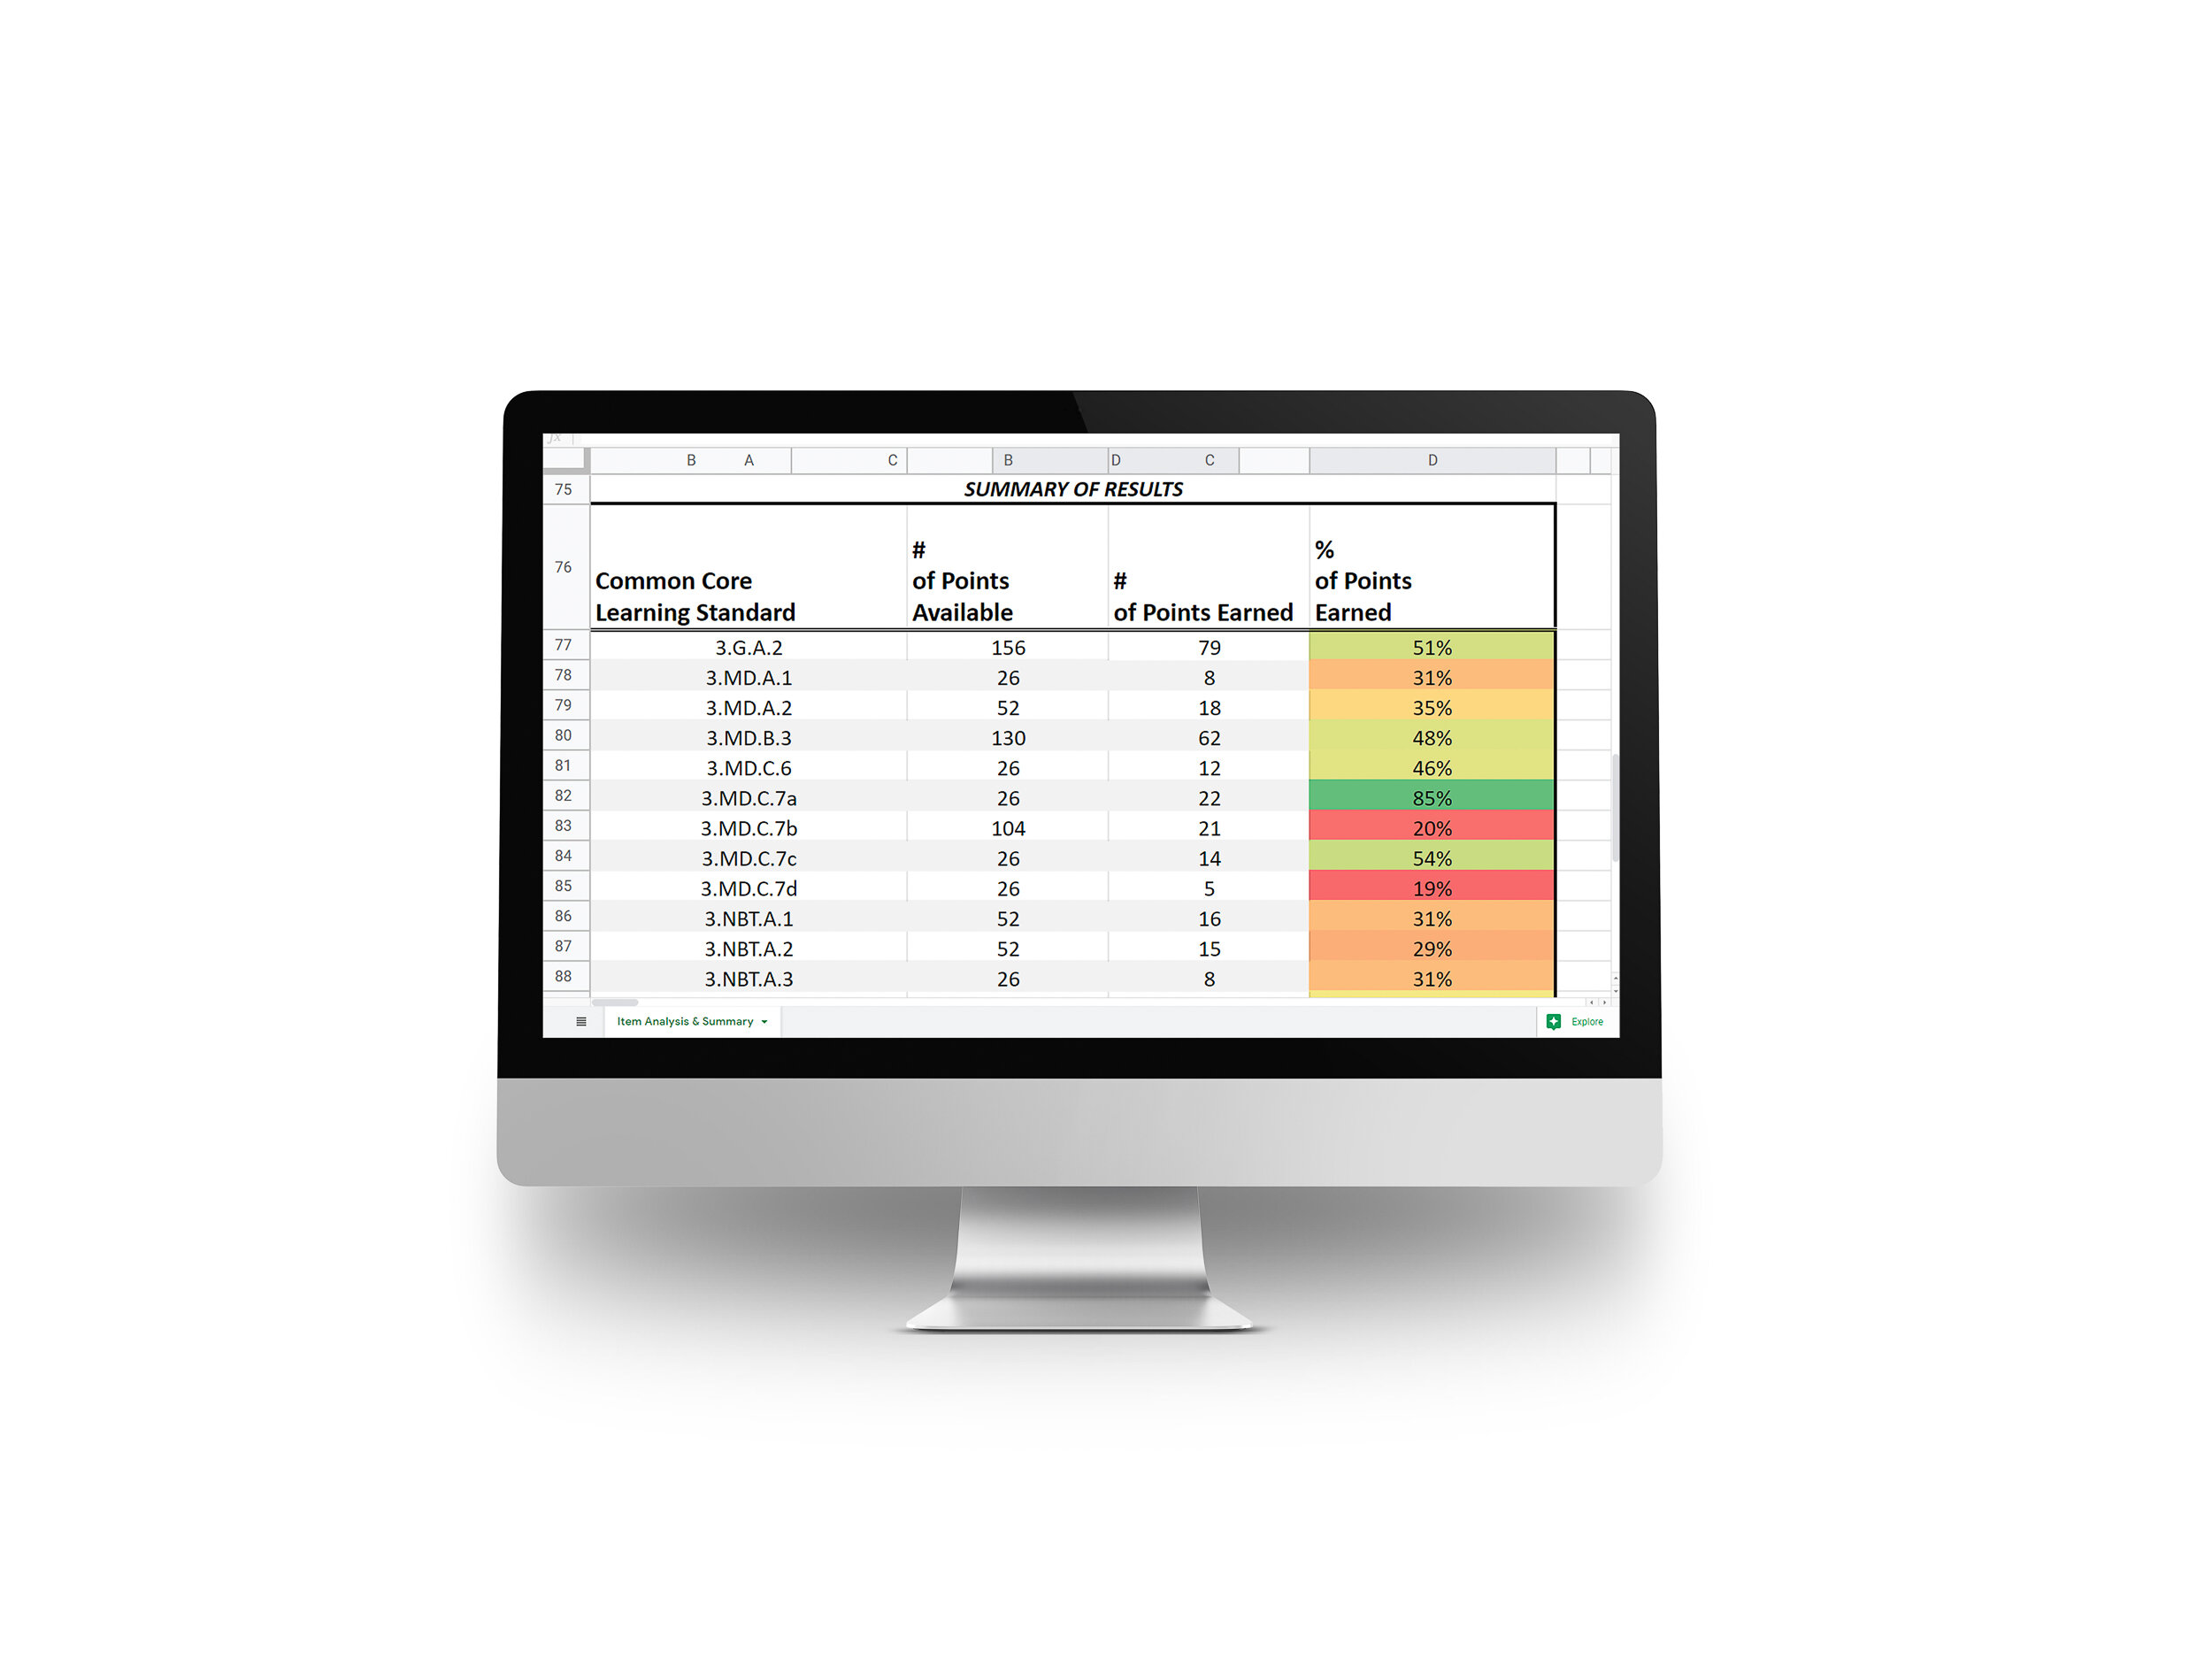
GCCS Data Analysis Kit: Work Process Step 5 of 5
Step 5 - Publish
I published the finished data kit on the school’s shared drive where all staff members could easily access it. The tool was used by teachers, school leaders and instructional coaches during their weekly meetings and it helped them with lesson planning and organizing small-group instruction.

Case Study 001. GCCS Dashboard: Step 3
Step 3 - Prep Data
This step was the heavy lift in this project. To complete it, I took the following actions:
I identified exactly what data needed to be displayed.
I identified sources for each of those data points.
I exported that data from school information systems (or requested a data export from an outside source).
I cleaned up and organized the data exports.
I compiled the data into Tableau-ready csv data files.