

Wednesday, January 11, 2023

Technical Documentation
Exploratory Data Analysis
Analysis By: David White
Technology Used: Python (NumPy, pandas, Matplotlib, seaborn)
Data Set: Storefronts Reported Vacant or Not
Topic: City Government
Data Source: City of New York

Tuesday, January 10, 2023

Technical Documentation
Exploratory Data Analysis
Analysis By: David White
Technology Used: Python (NumPy, pandas, Matplotlib, seaborn)
Data Set: Civil Service List (Active)
Topic: City Government
Data Source: City of New York

Monday, January 9, 2023

Technical Documentation
Exploratory Data Analysis
Analysis By: David White
Technology Used: Python (NumPy, pandas, Matplotlib, seaborn)
Data Set: Swimming Beach Attendance
Topic: City Government
Data Source: City of New York

Sunday, January 8, 2023

Technical Documentation
Exploratory Data Analysis
Analysis By: David White
Technology Used: Python (NumPy, pandas, Matplotlib, seaborn)
Data Set: Donations received by City Agencies
Topic: City Government
Data Source: City of New York

Saturday, January 7, 2023

Technical Documentation
Exploratory Data Analysis
Analysis By: David White
Technology Used: Python (NumPy, pandas, Matplotlib, seaborn)
Data Set: Youth Engagement by Category
Topic: City Government
Data Source: City of New York

Friday, January 6, 2023

Technical Documentation
Exploratory Data Analysis
Analysis By: David White
Technology Used: Python (NumPy, pandas, Matplotlib, seaborn)
Data Set: DCA Fines and Fees
Topic: City Government
Data Source: City of New York

Thursday, January 5, 2023

Technical Documentation
Exploratory Data Analysis
Analysis By: David White
Technology Used: Python (NumPy, pandas, Matplotlib, seaborn)
Data Set: Inspections
Topic: City Government
Data Source: City of New York

Wednesday, January 4, 2023

Technical Documentation
Exploratory Data Analysis
Analysis By: David White
Technology Used: Python (NumPy, pandas, Matplotlib, seaborn)
Data Set: .nyc Domain Registrations
Topic: City Government
Data Source: City of New York

Tuesday, January 3, 2023

Technical Documentation
Exploratory Data Analysis
Analysis By: David White
Technology Used: Python (NumPy, pandas, Matplotlib, seaborn)
Data Set: Film Permits
Topic: City Government
Data Source: City of New York
Monday, January 2, 2023

Technical Documentation
Exploratory Data Analysis
Analysis By: David White
Technology Used: Python (NumPy, pandas, Matplotlib, seaborn)
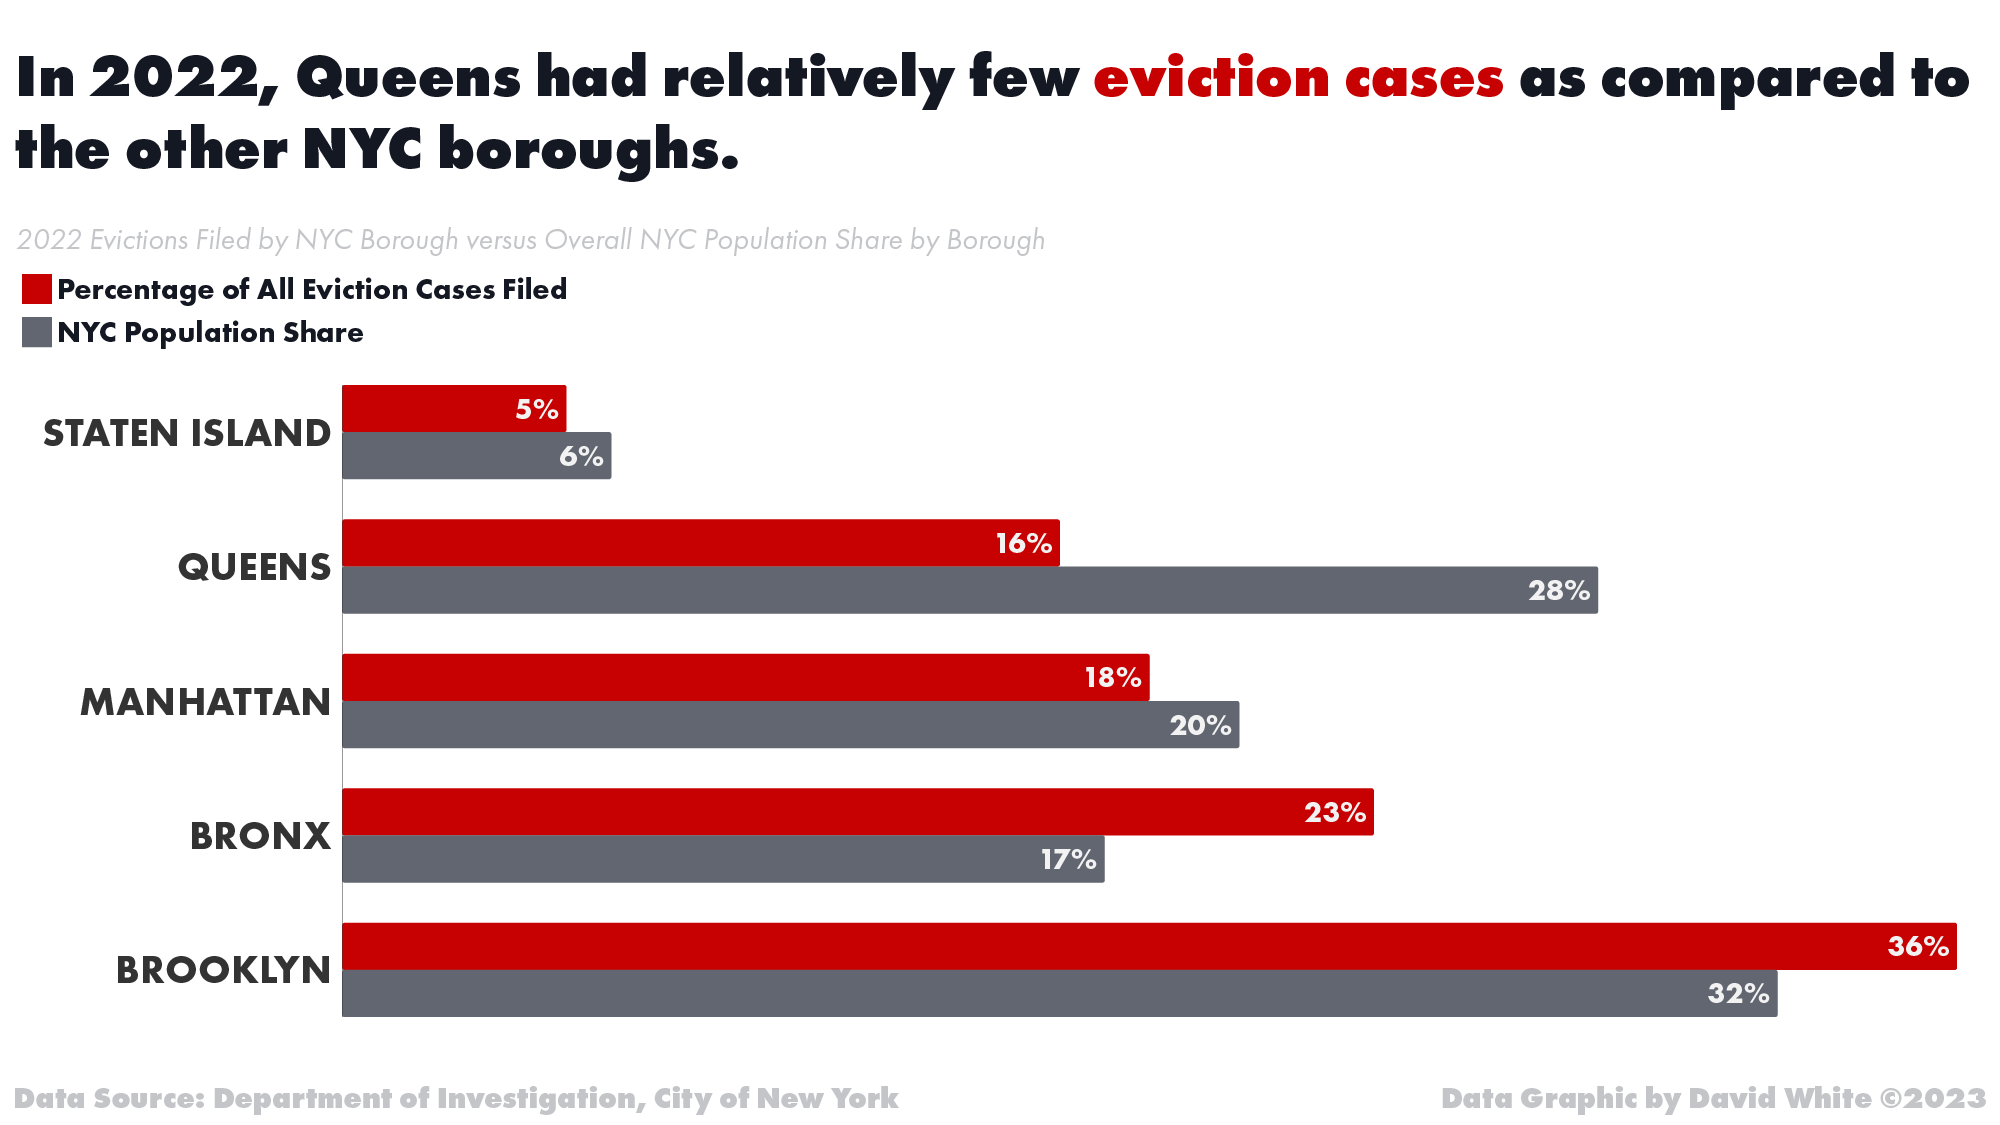
Data Set: Evictions
Topic: City Government
Data Source: City of New York
Sunday, January 1, 2023

Technical Documentation
Exploratory Data Analysis
Analysis By: David White
Technology Used: Python (NumPy, pandas, Matplotlib, seaborn)
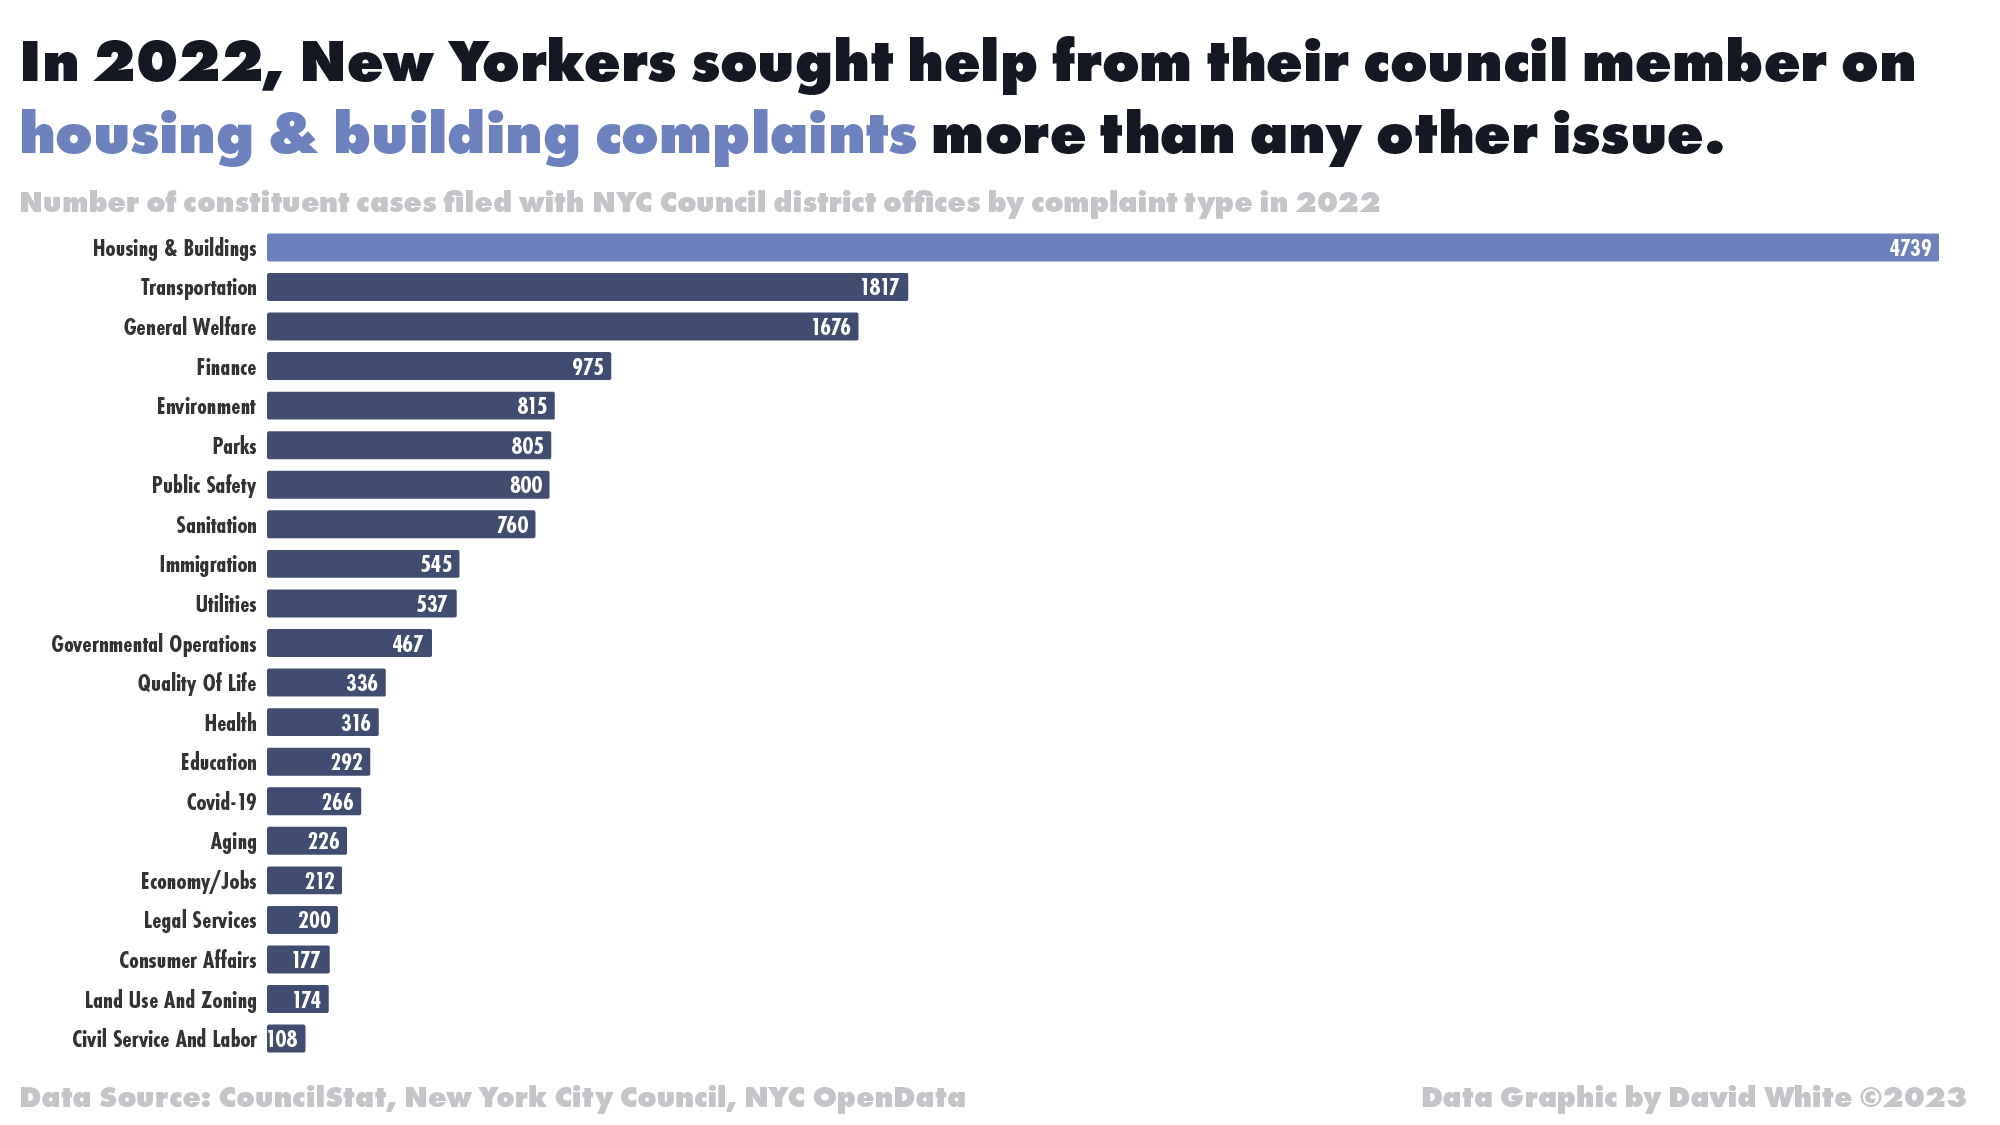
Data Set: NYC Council Constituent Services
Topic: City Government
Data Source: City of New York

Wednesday, July 28, 2021
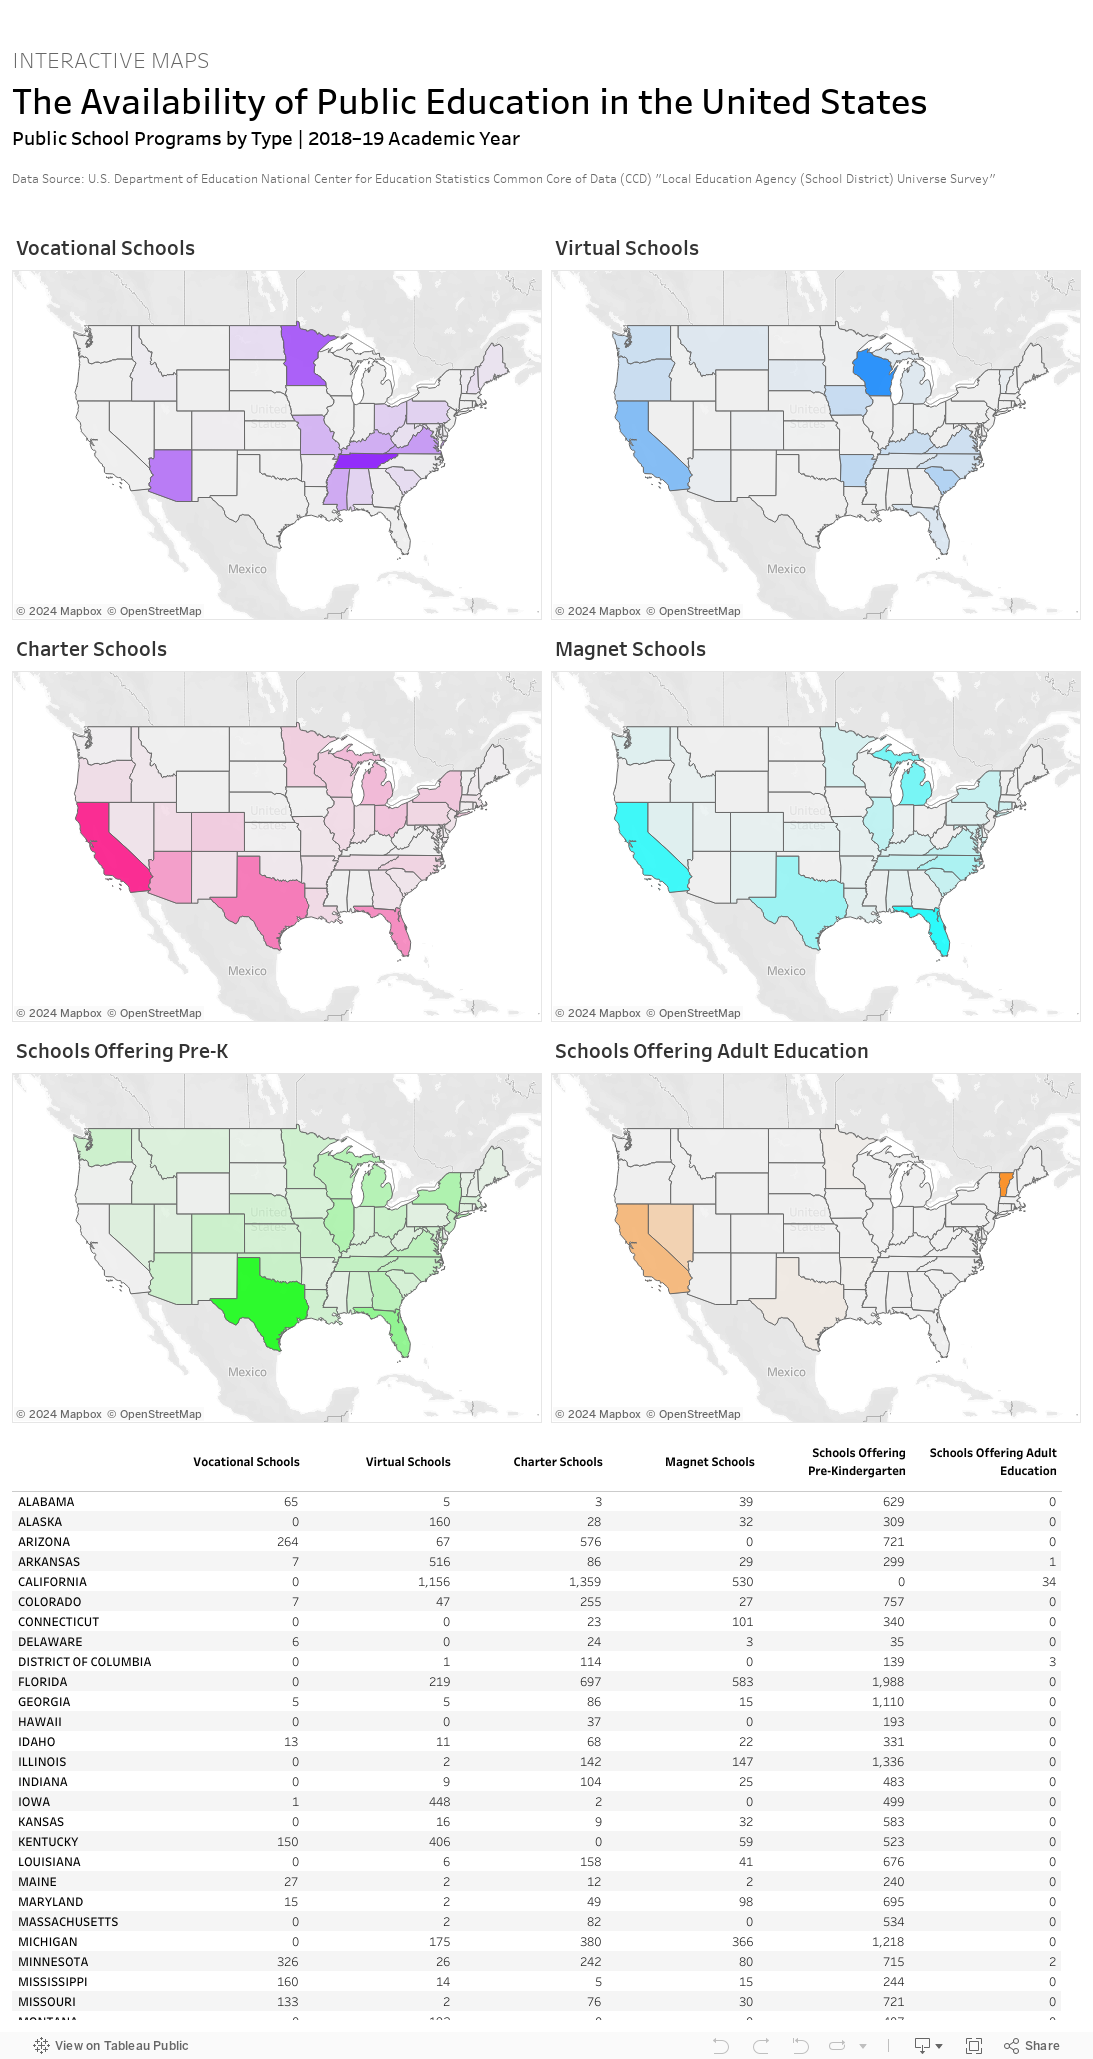
This collection of interactive maps shows where, geographically, alternative educational programs (such as vocational school, charter schools, magnet schools, etc.) are available in the United States.…Read More
Insights, Made Fresh Daily
Open Enrollment
The availability of alternative educational programs across various states
David White | Wednesday, July 28, 2021
This collection of interactive maps shows where, geographically, alternative educational programs (such as vocational school, charter schools, magnet schools, etc.) are available in the United States. The underlying data was released by the U.S. Department of Education.

Tuesday, July 27, 2021
There is a wide variance of average class sizes among states across the country.…Read More

Insights, Made Fresh Daily
Teaching and Learning
Student-teacher ratios vary greatly by state
David White | Tuesday, July 27, 2021
This line graph shows the student-teacher ratio of public schools in each state during the 2018–19 academic year. The underlying data was released by the U.S. Department of Education.
The graphic illustrates that there is a wide variance of average class sizes among states across the country.

Monday, July 26, 2021
Hawaii was the state with the highest percentage of non-white public school students with 88%…Read More

Insights, Made Fresh Daily
Diversity in Public Schools
The racial composition of public school student bodies in each state
David White | Monday, July 26, 2021
This bar graph shows the percentages of white and non-white public school students in each state during the 2018–19 academic year. The underlying data was released by the U.S. Department of Education.
Hawaii was the state with the highest percentage of non-white public school students with 88% non-white. Vermont was the state with the lowest percentage of non-white public school students with 10% non-white.

Sunday, July 25, 2021
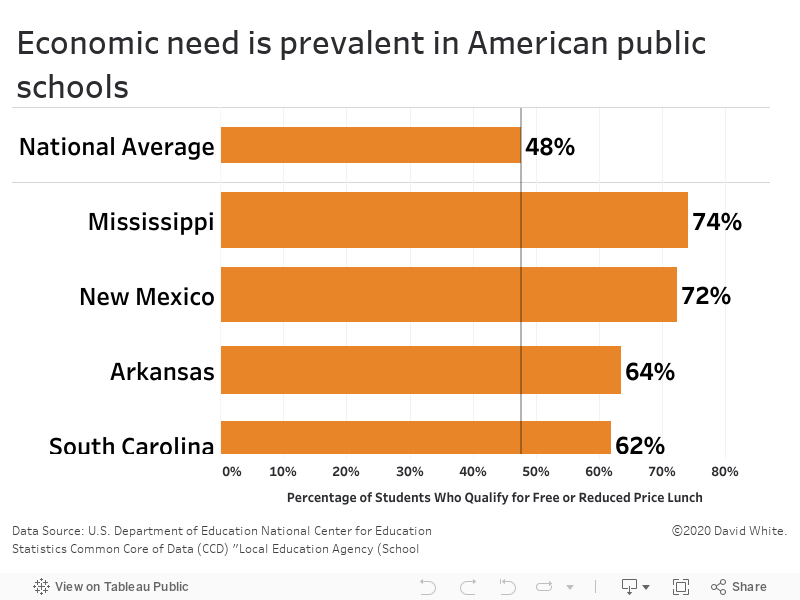
In public school reporting, “economic need” is defined by the percentage of students who qualify to receive a free or reduced price school lunch. The U.S. national average for economic need in public schools is 48%.…Read More
Insights, Made Fresh Daily
Economic Needs
48% of U.S. public school students qualify for free or reduced price lunch
David White | Sunday, July 25, 2021
This bar graph shows the rate of economic need of public schools in each state. In public school reporting, “economic need” is defined by the percentage of students who qualify to receive a free or reduced price school lunch. The U.S. national average for economic need in public schools is 48%. That figure is alarmingly high but what is more alarming is the fact that 19 states have economic need higher than 48%, the highest being Mississippi where 74% of all public school students qualify for free or reduced price lunch.
The underlying data was released by the U.S. Department of Education.

Saturday, July 24, 2021
Public school data analysis by state (part 2 of 2)…Read more

Public School Staffing by State - Exploratory Data Analysis (EDA) by David White
Insights, Made Fresh Daily
Exploratory Data Analysis
Public school data by state (part 2 of 2)
David White | Saturday, July 24, 2021
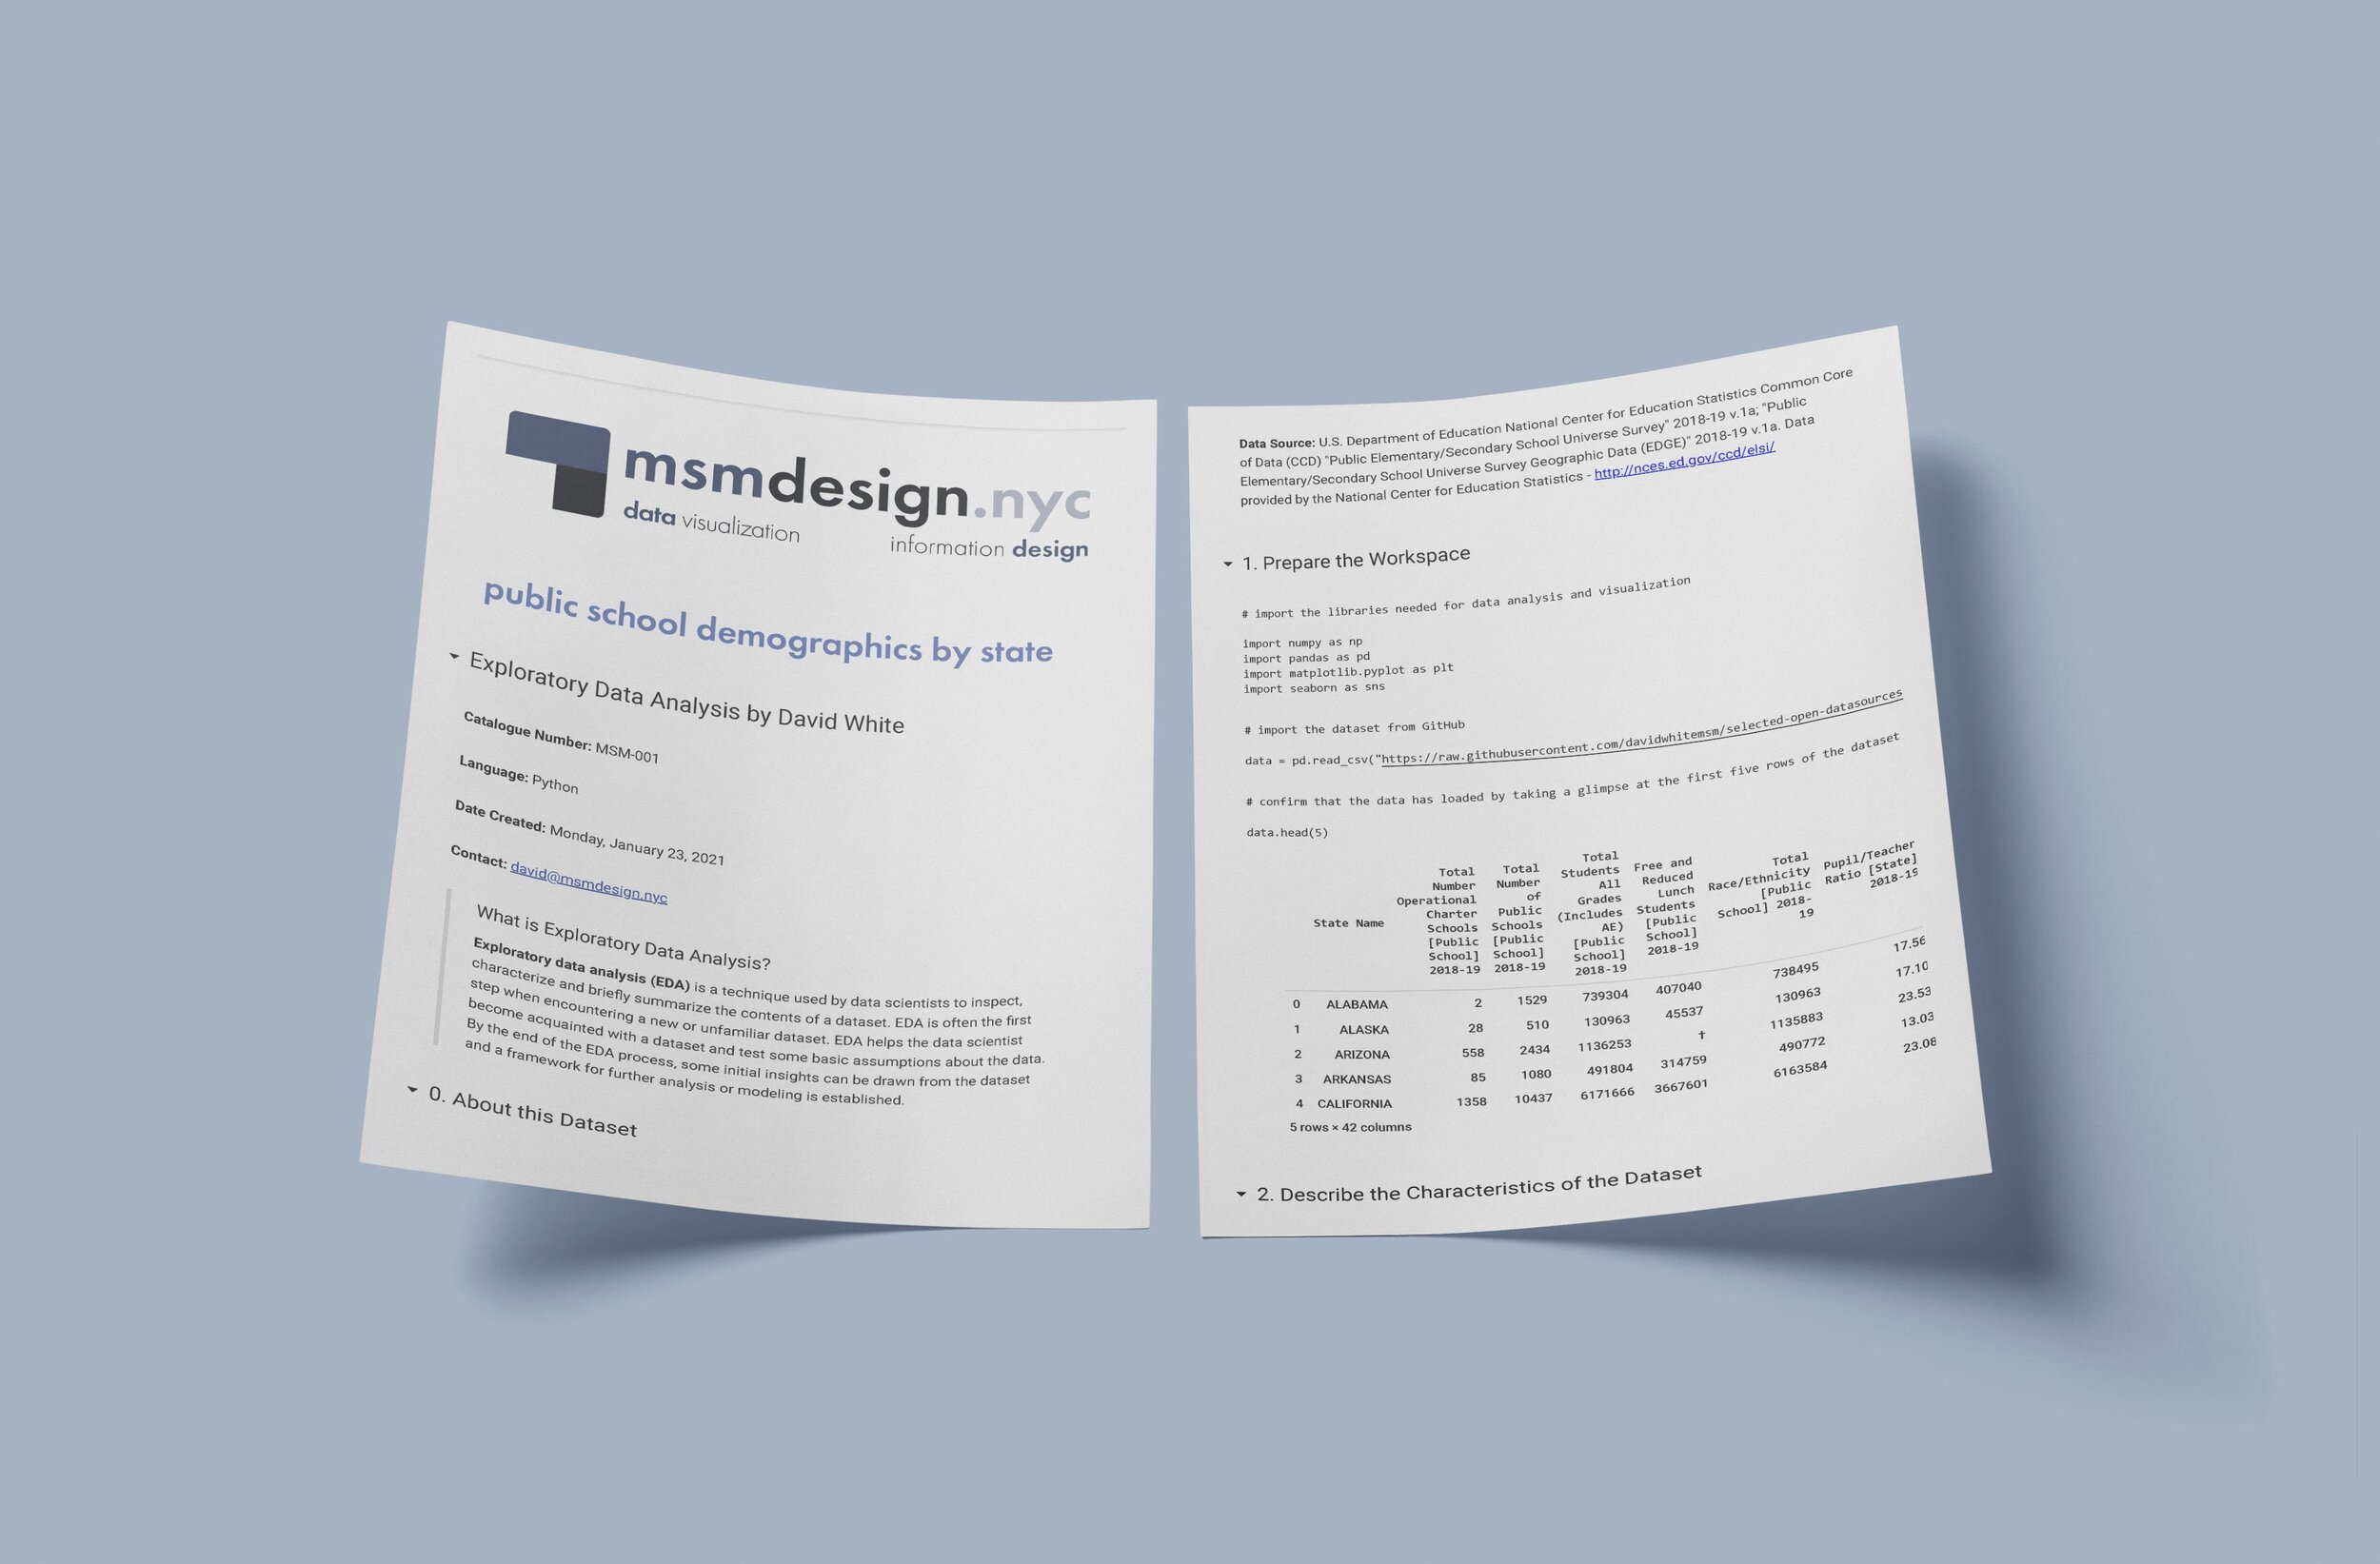
What is Exploratory Data Analysis?
Exploratory data analysis (EDA) is a technique used by data scientists to inspect, characterize and briefly summarize the contents of a dataset. EDA is often the first step when encountering a new or unfamiliar dataset. EDA helps the data scientist become acquainted with a dataset and test some basic assumptions about the data. By the end of the EDA process, some initial insights can be drawn from the dataset and a framework for further analysis or modeling is established.
This exploratory data analysis explores a dataset containing information on public schools in the United States. The underlying data was published by the United States Department of Education.
See also: Exploratory Data Analysis: Public School Demographics
Here are the takeaways from the dataset:
The dataset contains one row for each US state plus the District of Columbia
The dataset contains totals by state of the number of public schools in operation, total numbers of students and total for school teachers and administrators. The total number of students are roughly proportionate to the other three metrics.
In terms of school staffing, generally speaking, the total number of students is roughly proportionate to the other three metrics
Next Steps:
Possible avenues for further research and analysis:
There were some outliers shown in each scatterplot. It would be worth investigating why those particular states differ from the norm
This data could be joined with metrics on student achievement to study the correlation, if any, between staffing and student achievement
This data could be joined with metrics on income levels to study the correlation, if any, between income and student achievement

Friday, July 23, 2021
Public school data analysis by state (part 1 of 2)…Read more
Public School Demographics by State - Exploratory Data Analysis (EDA) by David White
Insights, Made Fresh Daily
Exploratory Data Analysis
Public school data by state (part 1 of 2)
David White | Friday, July 23, 2021
What is Exploratory Data Analysis?Exploratory data analysis (EDA) is a technique used by data scientists to inspect, characterize and briefly summarize the contents of a dataset. EDA is often the first step when encountering a new or unfamiliar dataset. EDA helps the data scientist become acquainted with a dataset and test some basic assumptions about the data. By the end of the EDA process, some initial insights can be drawn from the dataset and a framework for further analysis or modeling is established.
This exploratory data analysis explores a dataset of information on public schools in the United States. The underlying data was released by the U.S. Department of Education.
See also: Exploratory Data Analysis: Public School Staffing
Here are the takeaways from the dataset:
The dataset consists of 51 rows and 42 columns
The dataset consists of:
student enrollment
school staffing
student demographic information
There are 51 rows and 42 columns in the dataset. None of the rows are blank.
The dataset contains totals per state of the number of students in (2) gender categories and (7) race/ethnicity categories.
2018-19 US public school total enrollments by demographic group are as follows:
25.8 million male students
24.4 million female students
473K American Indian/Alaska Native students
2.6 million Asian or Asian/Pacific Islander students
13.7 million Hispanic students
7.6 million Black students
23.7 million White students
176K Hawaiian Nat./Pacific Isl. students
2 million multiracial students
The states with the highest number of Black public school students are: Florida, Georgia and Texas
The states with the highest number of Hispanic public school students are: California and Texas
The state with the highest number of Asian or Asian/Pacific Islander public school students is California. New York and Texas are a distant second and third.
The states with the highest number of American Indian/Alaska Native public school students by far is Oklahoma
The state with the highest number of Hawaiian/Pacific Islander public school students by far is Hawaii
The states with the highest number of White public school students are: California and Texas
Key Insight:
Populations of White students and populations of White students are mostly in portion with the state's overall population. However, for other demographic groups, students of that ethnicity are more heavily concentrated in just a handful of states.

Thursday, July 22, 2021
NYC charter high school students rarely dropped out of school…Read More
Insights, Made Fresh Daily
Staying the Course
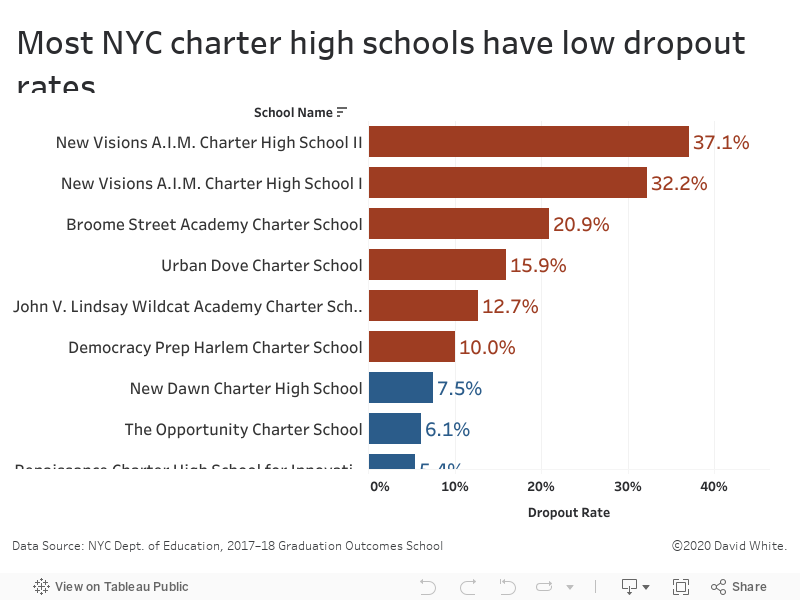
NYC charter high school students rarely dropped out of school
David White | Thursday, July 22, 2021
This bar graph shows the 2017–18 dropout rates of each NYC charter high school. The underlying data was released by the City of New York.
A large majority of NYC charter high schools had a dropout rate of 7.5% or less. Only six schools had a dropout rate of 10% or more.
See also: MSM-E21. NYC charter graduation rates outpace the city average

Wednesday, July 21, 2021
NYC charters graduated seniors at a higher rate than the citywide average…Read More
Insights, Made Fresh Daily
Graduation Days
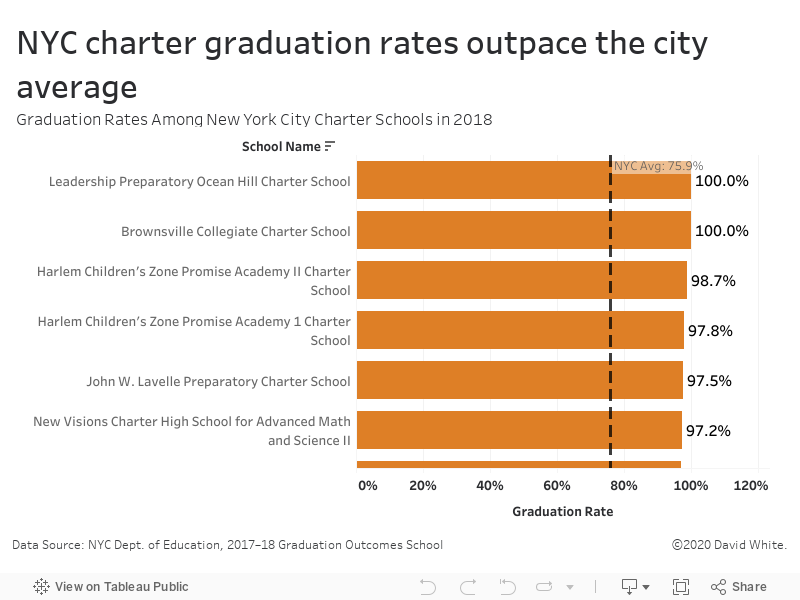
NYC charters graduated seniors at a higher rate than the citywide average
David White | Wednesday, July 21, 2021
This bar graph shows the 2017–18 graduation rates of each NYC charter high school. The underlying data was released by the City of New York.
In the 2017–18 academic year, the citywide graduation rate was 75.9%. A large majority of charter high schools outperformed the citywide average graduation rate.
See also: MSM-E22. Most NYC charter high schools have low dropout rates

Tuesday, July 20, 2021
Most NYC charter school graduates earned standard Regents diplomas…Read More

Insights, Made Fresh Daily
Advanced Diplomas
Most NYC charter school graduates earned standard Regents diplomas
David White | Tuesday, July 20, 2021
This bar graph shows a breakdown of the types of diplomas earned by NYC charter high school graduates in the 2017–18 academic year. The underlying data was released by the City of New York.
A large majority of NYC charter high school graduates earned standard Regents diplomas. Relatively few graduates earned local diplomas or Advanced Regents diplomas.