

Monday, July 26, 2021
Hawaii was the state with the highest percentage of non-white public school students with 88%…Read More

Insights, Made Fresh Daily
Diversity in Public Schools
The racial composition of public school student bodies in each state
David White | Monday, July 26, 2021
This bar graph shows the percentages of white and non-white public school students in each state during the 2018–19 academic year. The underlying data was released by the U.S. Department of Education.
Hawaii was the state with the highest percentage of non-white public school students with 88% non-white. Vermont was the state with the lowest percentage of non-white public school students with 10% non-white.

Wednesday, July 7, 2021
Charter schools dominate the conversation, but not the enrollment numbers…Read more
Insights, Made Fresh Daily
Out of Proportion
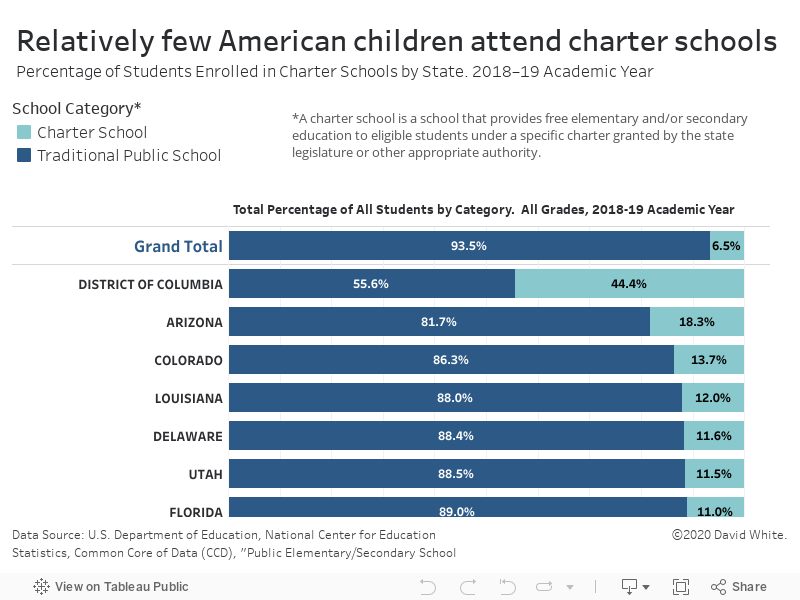
Charter schools dominate the conversation, but not the enrollment numbers
David White | Wednesday, July 7, 2021
This 100% bar graph shows the proportion of U.S. students that are enrolled in charter schools vs. how many are enrolled in traditional public schools. The underlying data was released by the U.S. Department of Education.
Despite their prominence in the national conversation and some very high-profile advocates (and detractors), charter schools account for only 6.5% of all public school students in the United States.