

Saturday, July 24, 2021
Public school data analysis by state (part 2 of 2)…Read more

Public School Staffing by State - Exploratory Data Analysis (EDA) by David White
Insights, Made Fresh Daily
Exploratory Data Analysis
Public school data by state (part 2 of 2)
David White | Saturday, July 24, 2021
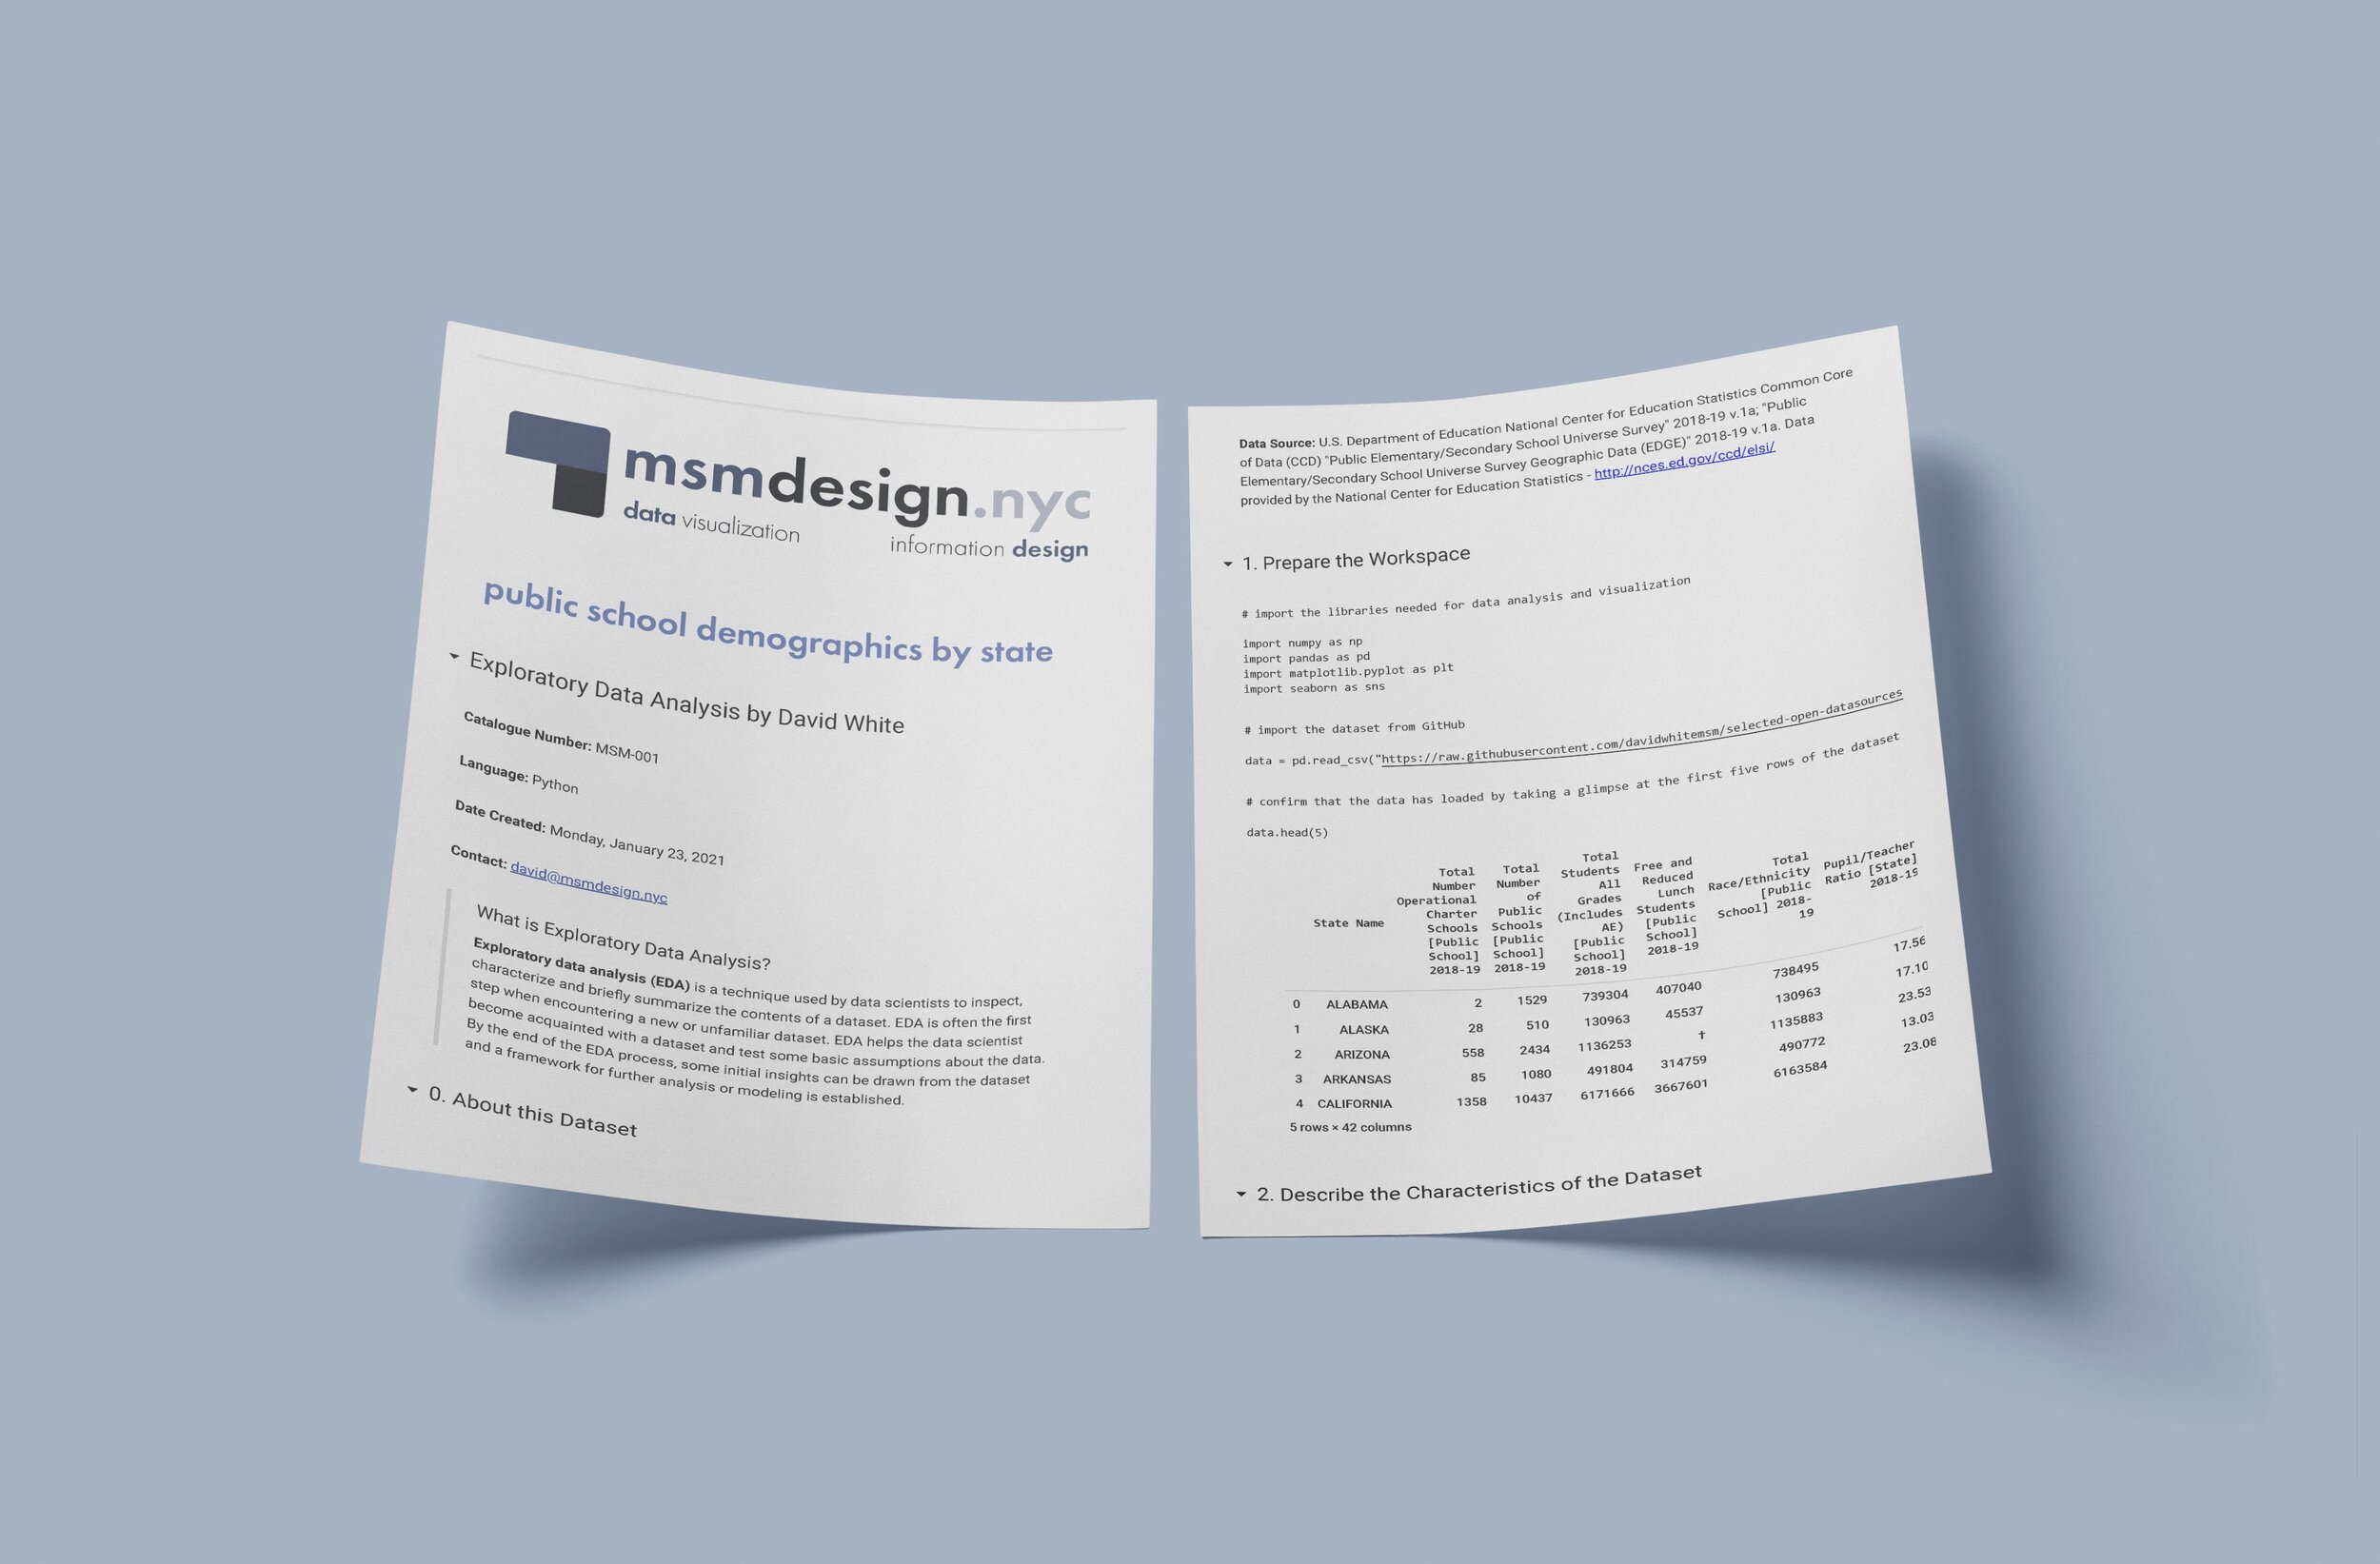
What is Exploratory Data Analysis?
Exploratory data analysis (EDA) is a technique used by data scientists to inspect, characterize and briefly summarize the contents of a dataset. EDA is often the first step when encountering a new or unfamiliar dataset. EDA helps the data scientist become acquainted with a dataset and test some basic assumptions about the data. By the end of the EDA process, some initial insights can be drawn from the dataset and a framework for further analysis or modeling is established.
This exploratory data analysis explores a dataset containing information on public schools in the United States. The underlying data was published by the United States Department of Education.
See also: Exploratory Data Analysis: Public School Demographics
Here are the takeaways from the dataset:
The dataset contains one row for each US state plus the District of Columbia
The dataset contains totals by state of the number of public schools in operation, total numbers of students and total for school teachers and administrators. The total number of students are roughly proportionate to the other three metrics.
In terms of school staffing, generally speaking, the total number of students is roughly proportionate to the other three metrics
Next Steps:
Possible avenues for further research and analysis:
There were some outliers shown in each scatterplot. It would be worth investigating why those particular states differ from the norm
This data could be joined with metrics on student achievement to study the correlation, if any, between staffing and student achievement
This data could be joined with metrics on income levels to study the correlation, if any, between income and student achievement

Friday, July 23, 2021
Public school data analysis by state (part 1 of 2)…Read more
Public School Demographics by State - Exploratory Data Analysis (EDA) by David White
Insights, Made Fresh Daily
Exploratory Data Analysis
Public school data by state (part 1 of 2)
David White | Friday, July 23, 2021
What is Exploratory Data Analysis?Exploratory data analysis (EDA) is a technique used by data scientists to inspect, characterize and briefly summarize the contents of a dataset. EDA is often the first step when encountering a new or unfamiliar dataset. EDA helps the data scientist become acquainted with a dataset and test some basic assumptions about the data. By the end of the EDA process, some initial insights can be drawn from the dataset and a framework for further analysis or modeling is established.
This exploratory data analysis explores a dataset of information on public schools in the United States. The underlying data was released by the U.S. Department of Education.
See also: Exploratory Data Analysis: Public School Staffing
Here are the takeaways from the dataset:
The dataset consists of 51 rows and 42 columns
The dataset consists of:
student enrollment
school staffing
student demographic information
There are 51 rows and 42 columns in the dataset. None of the rows are blank.
The dataset contains totals per state of the number of students in (2) gender categories and (7) race/ethnicity categories.
2018-19 US public school total enrollments by demographic group are as follows:
25.8 million male students
24.4 million female students
473K American Indian/Alaska Native students
2.6 million Asian or Asian/Pacific Islander students
13.7 million Hispanic students
7.6 million Black students
23.7 million White students
176K Hawaiian Nat./Pacific Isl. students
2 million multiracial students
The states with the highest number of Black public school students are: Florida, Georgia and Texas
The states with the highest number of Hispanic public school students are: California and Texas
The state with the highest number of Asian or Asian/Pacific Islander public school students is California. New York and Texas are a distant second and third.
The states with the highest number of American Indian/Alaska Native public school students by far is Oklahoma
The state with the highest number of Hawaiian/Pacific Islander public school students by far is Hawaii
The states with the highest number of White public school students are: California and Texas
Key Insight:
Populations of White students and populations of White students are mostly in portion with the state's overall population. However, for other demographic groups, students of that ethnicity are more heavily concentrated in just a handful of states.

Sunday, July 11, 2021
This exploratory data analysis examines a dataset of information on public schools in the City of New York…Read More

Student-Teacher Ratios - Exploratory Data Analysis (EDA) by David White
Insights, Made Fresh Daily
Exploratory Data Analysis
Student-Teacher Ratios in NYC Public Schools
David White | Sunday, July 11, 2021
What is Exploratory Data Analysis?
Exploratory data analysis (EDA) is a technique used by data scientists to inspect, characterize and briefly summarize the contents of a dataset. EDA is often the first step when encountering a new or unfamiliar dataset. EDA helps the data scientist become acquainted with a dataset and test some basic assumptions about the data. By the end of the EDA process, some initial insights can be drawn from the dataset and a framework for further analysis or modeling is established.
This exploratory data analysis examines a dataset of information on public schools in the City of New York. The underlying data was released by the City of New York.