
Friday, July 16, 2021
Forster children face significant challenges when it comes to schooling…Read More
Insights, Made Fresh Daily
Home & School
Forster children face significant challenges when it comes to schooling
David White | Friday, July 16, 2021
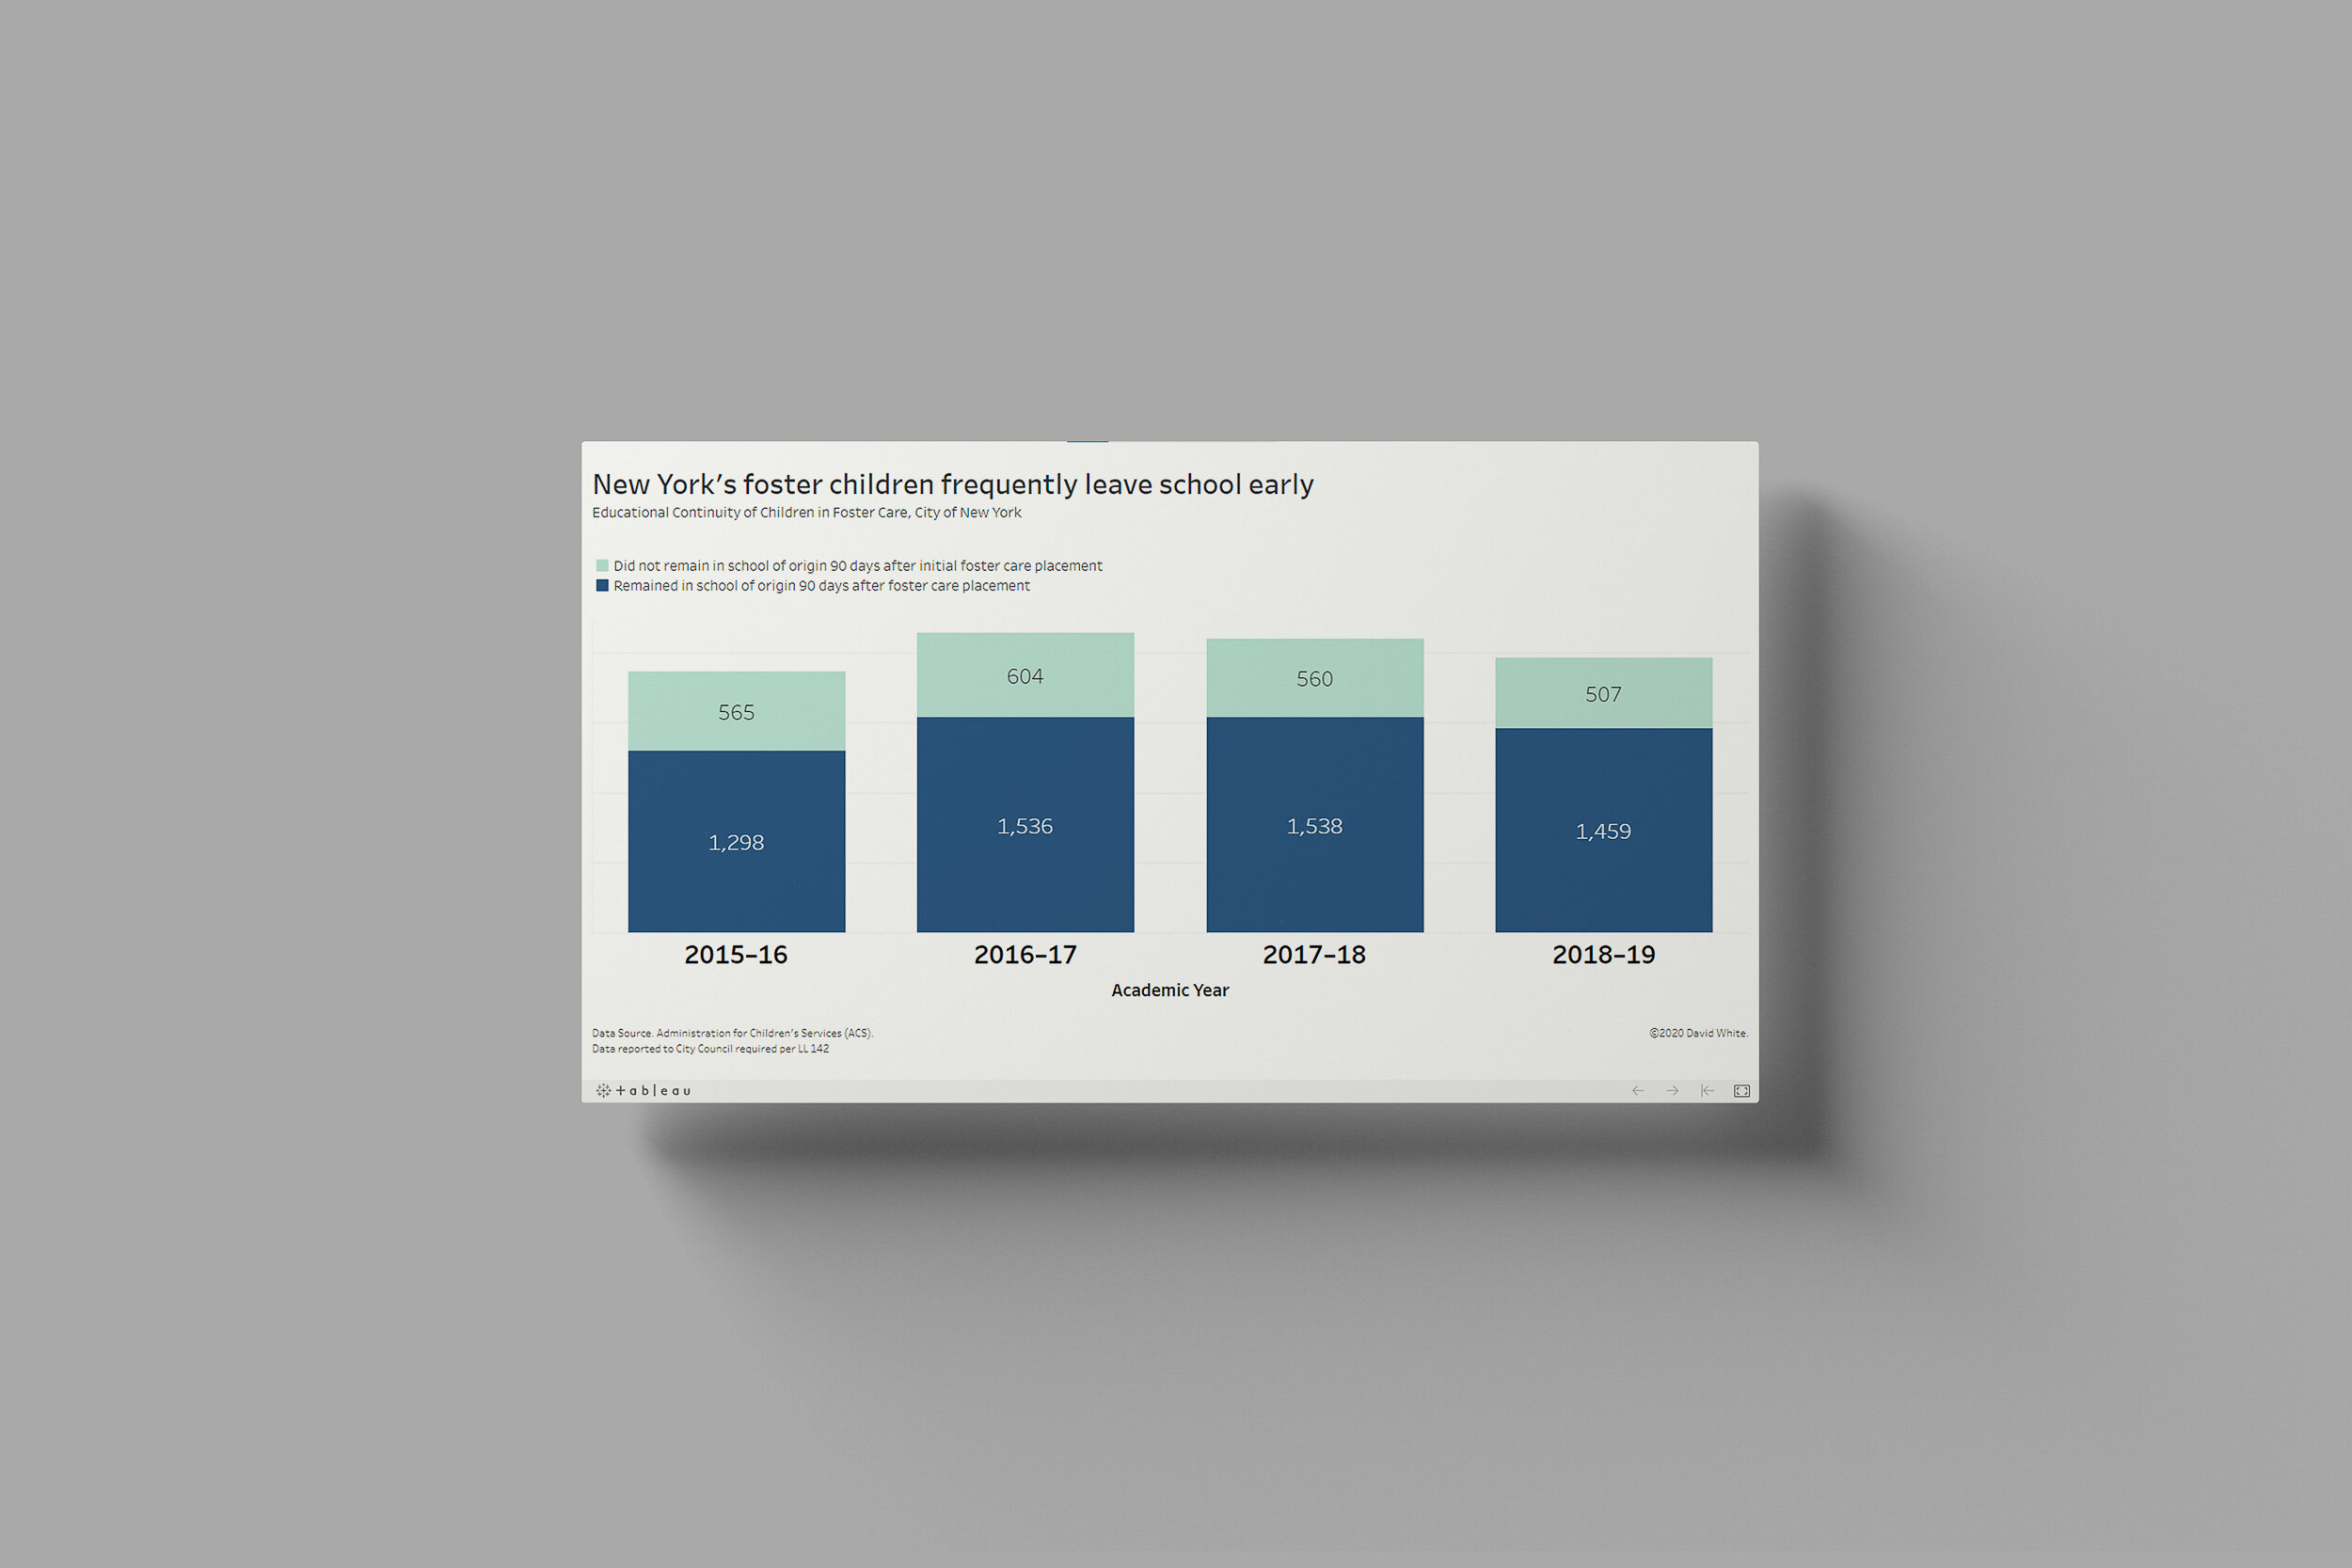
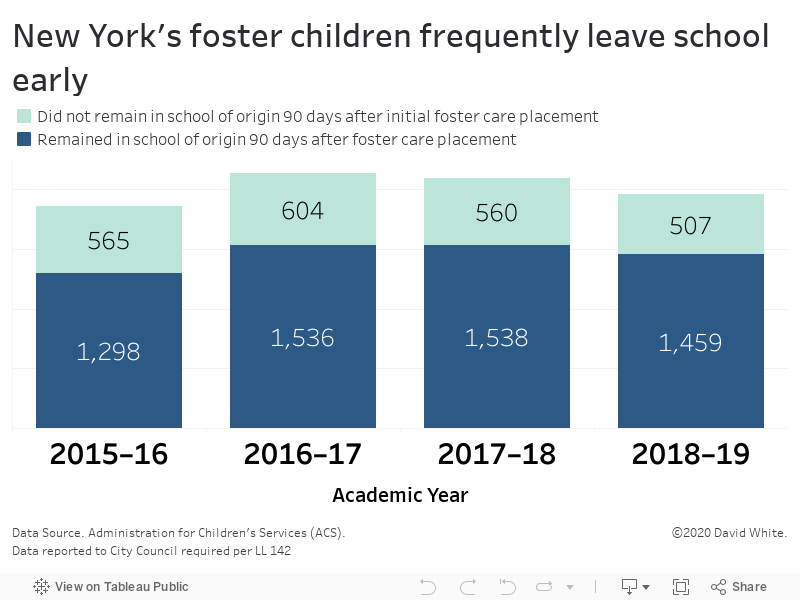
This bar chart illustrates the one of the many difficulties affecting foster children. Within 90 days of their initial foster care placement, a large number of children had already changed schools at least once. The underlying data was released by the City of New York.

Monday, July 12, 2021
NYC's students are better prepared for college than they were four years ago…Read More
![[SUBSET - College Readiness, 2013 vs. 2017] MSM-DS09-Social_Indicator_Report_Data](https://images.squarespace-cdn.com/content/v1/5a1ce5de18b27dba1cfec1fa/1612032677761-P2AK7MRSC0PF1LP4OKQS/%5BSUBSET+-+College+Readiness%2C+2013+vs.+2017%5D+MSM-DS09-Social_Indicator_Report_Data)
Insights, Made Fresh Daily
Being Prepared
NYC's students are better prepared for college than they were four years ago
David White | Monday, July 12, 2021
This collection of slope graphs illustrates the recent trends in college readiness among NYC high school graduates in various demographic subgroups. The underlying data was released by the City of New York.
The data graphics show an upward trend in the percentage of students who are “college ready” according to The College Readiness Index:
The College Readiness Index (CRI) is calculated by the NYC Department of Education and includes students who meet CUNY’s remediation standards, which are currently defined as: (1) graduated by August with a Regents diploma, (2) earned a 75+ on the English Regents exam, or scored 480+ on the Critical Reading SAT, or scored a 20+ on the ACT English, or scored a 70+ on the CUNY Reading Assessment and a 56+ on the CUNY Writing Assessment, and (3) scored an 80+ on a Math Regents, or 70+ on a Common Core Algebra or Geometry Regents and completed coursework in Algebra II/Trigonometry or higher, or scored 480+ on the Math SAT, or scored a 20+ on the ACT Math, or scored a 40+ on the CUNY Math Assessment, or scored an 80+ on the PBAT and completed required coursework.
Source: NYC Department of Education

Thursday, July 1, 2021
New York City’s high schools are producing more graduates In recent years…Read More
Insights, Made Fresh Daily
Upward Bound
New York City’s high schools are producing more graduates In recent years
David White | Thursday, July 1, 2021
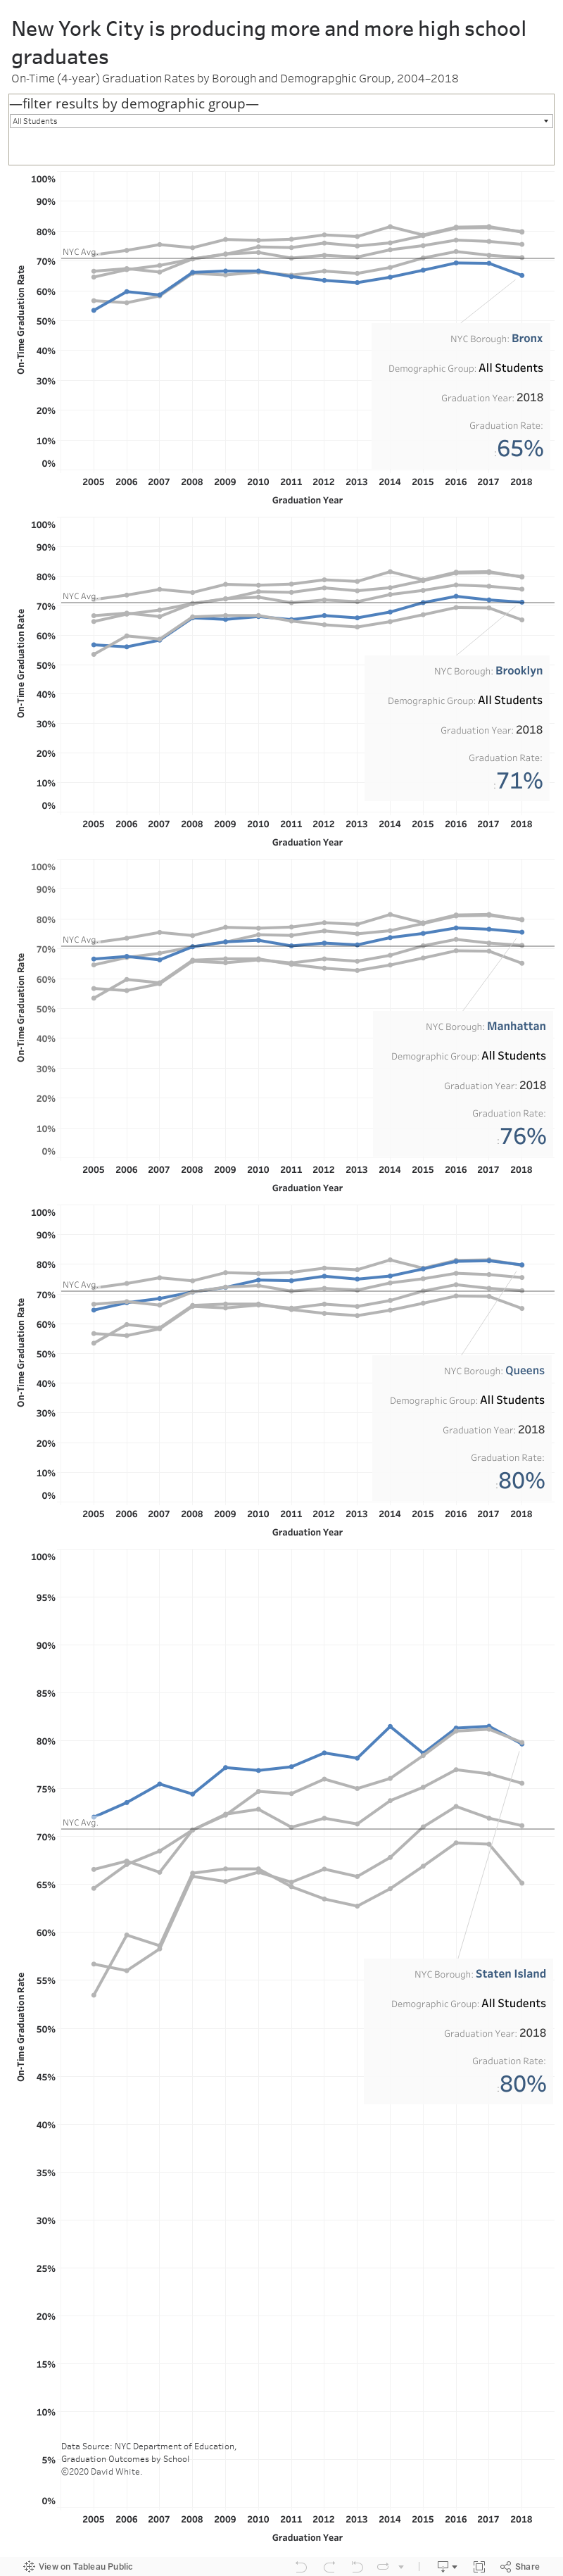
This line graph illustrates the recent trends in NYC high school graduation rates. The underlying data was released by the City of New York.
The data graphic shows the graduation rates of New York City high school students between the years of 2004 and 2018. During that stretch of time, the average gradation rate citywide was 71%. Looking at the 14-year time period as a whole, the NYC graduation rates are trending upward.