

Sunday, July 18, 2021
The racial composition of NYC public high schools…Read More
Insights, Made Fresh Daily
Percent Composition
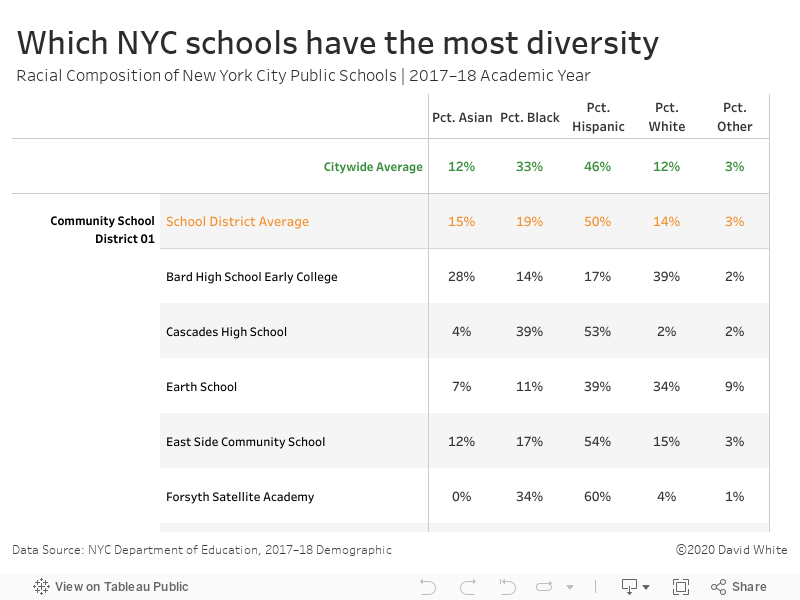
The racial composition of NYC public high schools
David White | Sunday, July 18, 2021
This graphic organizer lists the racial composition of individual NYC public schools. The citywide averages and the school district averages are shown at the top in orange and green respectively. The underlying data was released by the City of New York.
Saturday, July 17, 2021
Education outcomes in NYC public high schools…Read More
Insights, Made Fresh Daily
Results May Vary
Education outcomes in NYC public high schools
David White | Saturday, July 17, 2021
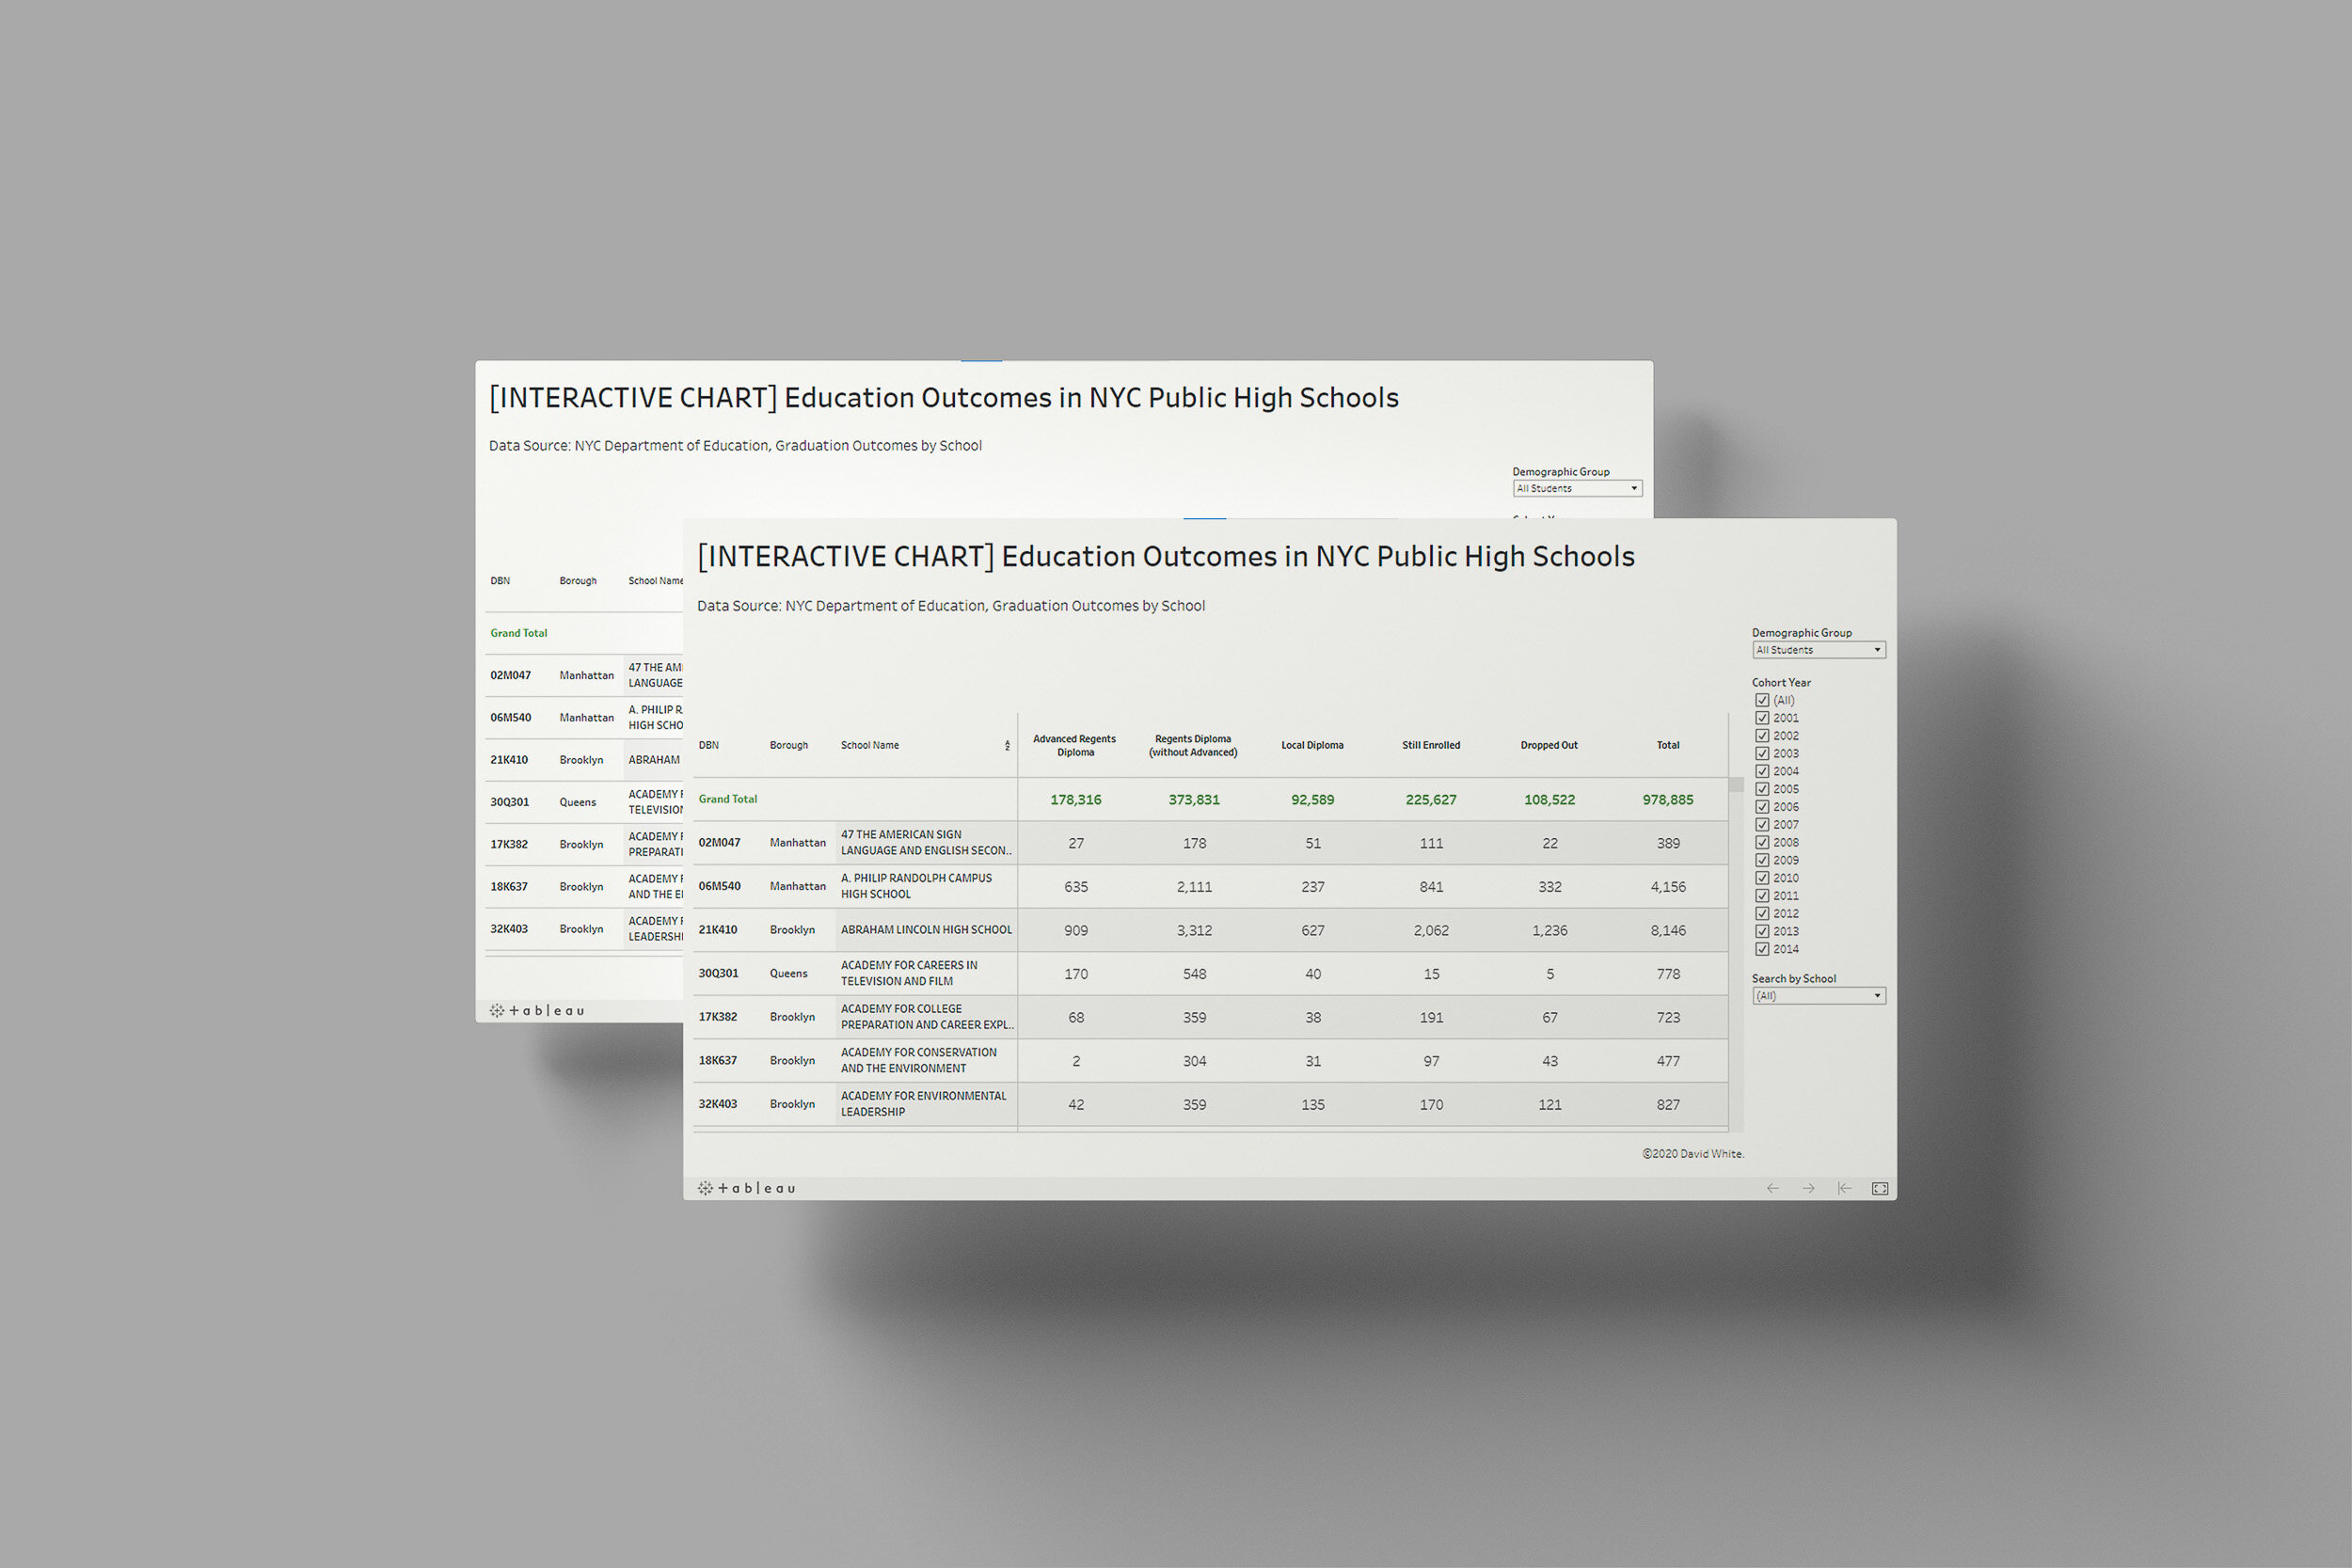
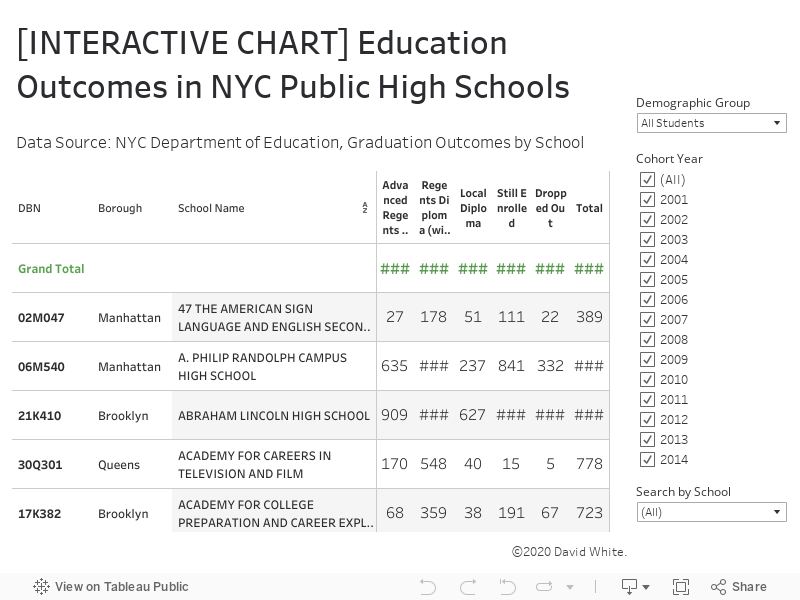
This dashboard shows the education outcomes (diploma, dropped out or still enrolled) of each NYC public high school. The chart is filterable by cohort year and demographic subgroup. The underlying data was released by the City of New York.

Saturday, July 10, 2021
The secondary school outcomes of NYC students…Read more
Insights, Made Fresh Daily
Futures in Focus
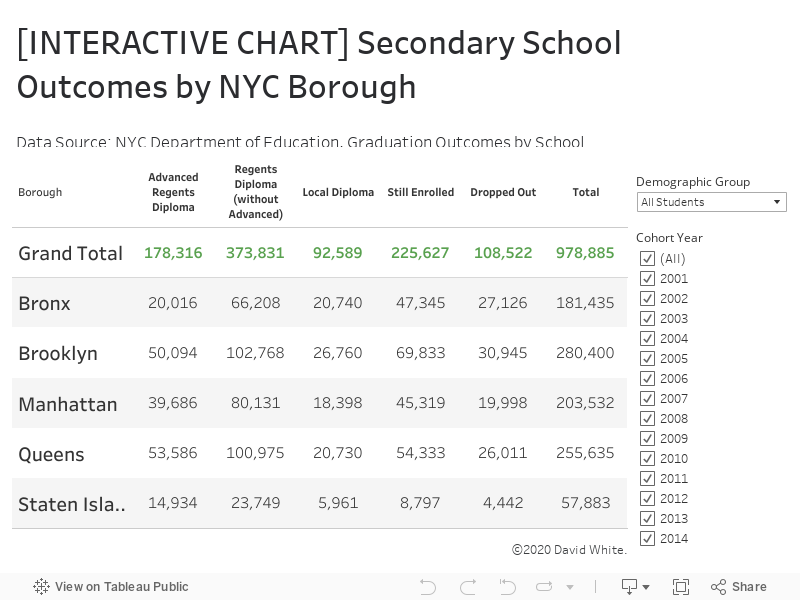
The secondary school outcomes of NYC students
David White | Saturday, July 10, 2021
This graphic organizer shows the recent graduation outcomes of students enrolled in NYC high schools. The chart is filterable and allows you to sort the data by cohort year (the year a student entered 9th grade) and demographic subgroup. The underlying data was released by the City of New York.

Tuesday, July 6, 2021
The City of New York has its sights set on some lofty goals…Read more
Insights, Made Fresh Daily
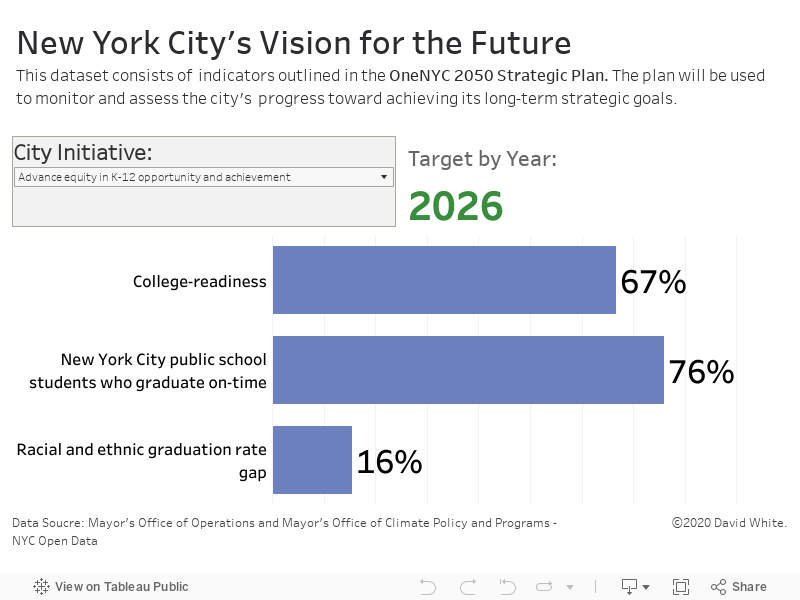
Higher Aspirations
The City of New York has its sights set on some lofty goals
David White | Tuesday, July 6, 2021
This dashboard shows goals that the government of the City of New York has set for various areas of public life. The underlying data was released by the City of New York.
The interactive data visualization outlines each of goals laid out in the OneNYC 2050 Strategic Plan along with the target numbers the city is trying to achieve and the dates by which they aim to achieve them.
Sunday, July 4, 2021
2019 New York State Common Core Learning Standard Exam results…Read more
Insights, Made Fresh Daily
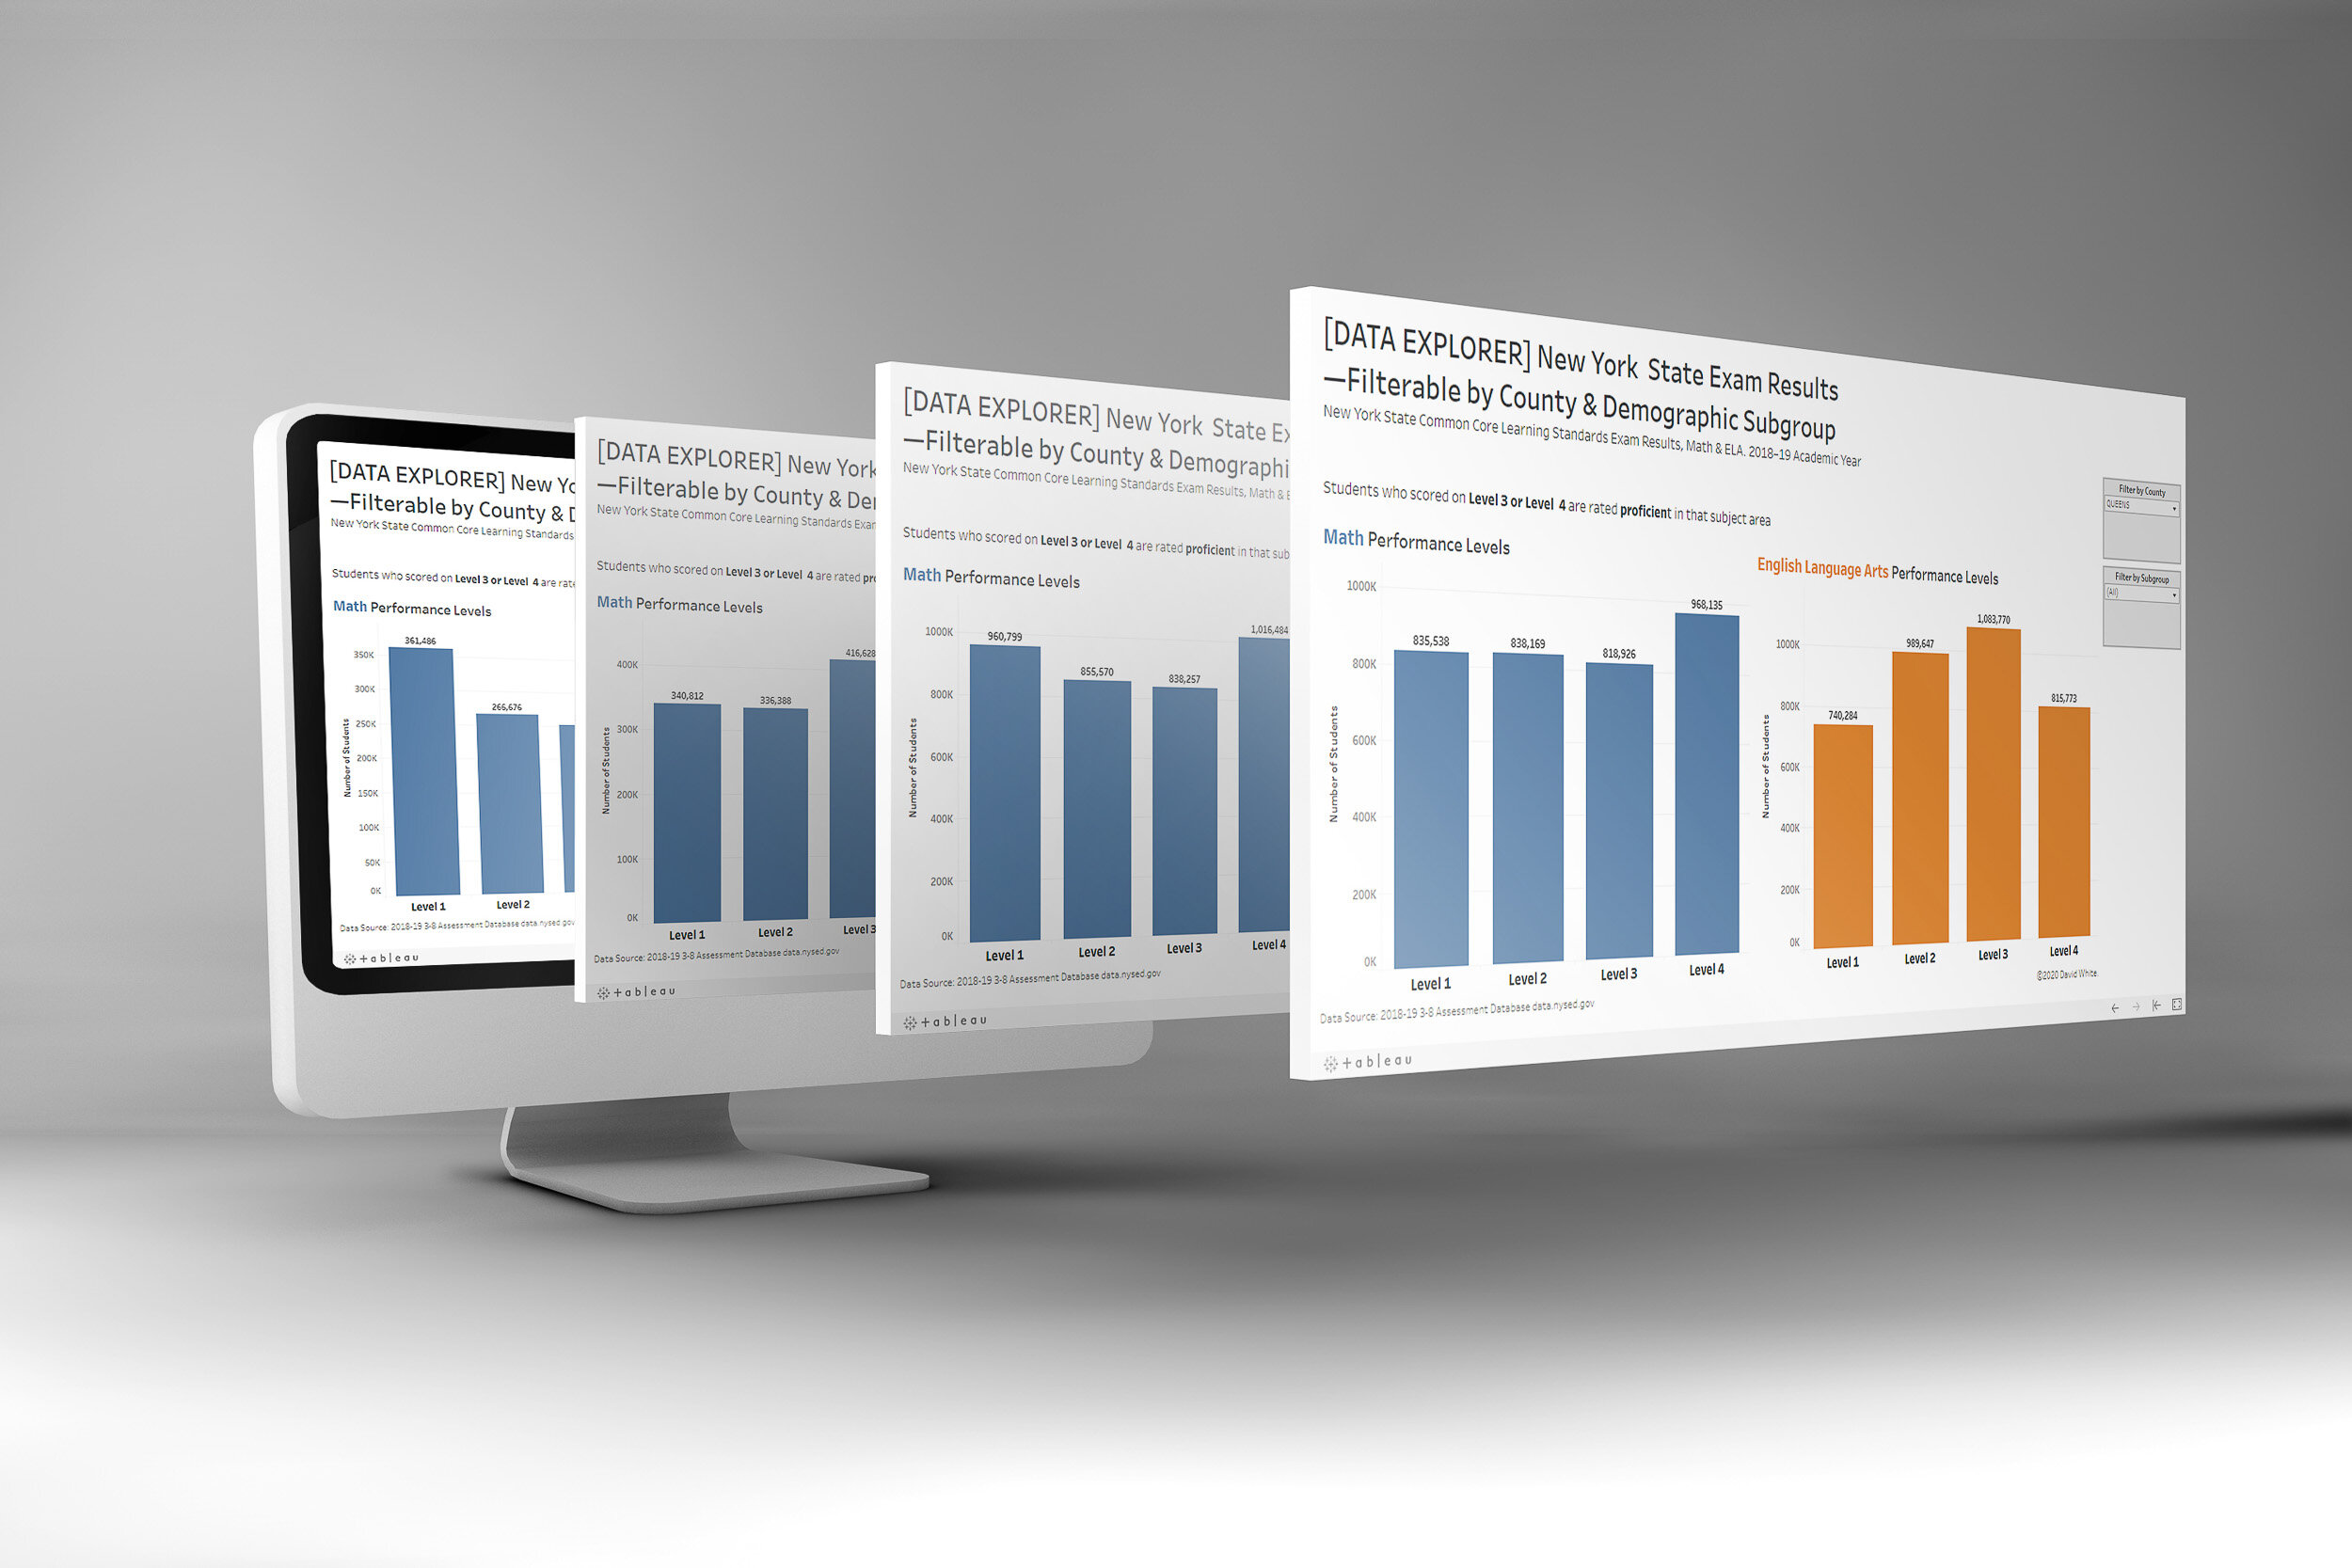
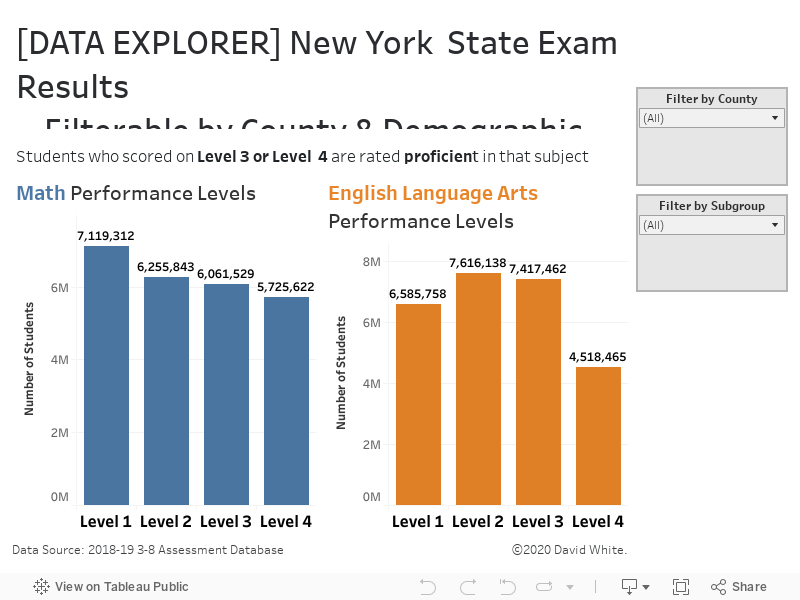
Data Explorer
2019 New York State Common Core Learning Standard Exam results
David White | Sunday, July 4, 2021
This dashboard shows the results of the 2019 New York State Common Core Learning Standard Exam (NYS CCLS). It displays the English Language Arts (ELA) and Math exam scores of New York City public school students in Grades 3–8. The dashboard is filterable by county and demographic subgroup. The underlying data was released by the New York State Education Department (NYSED).