

Sunday, July 18, 2021
The racial composition of NYC public high schools…Read More
Insights, Made Fresh Daily
Percent Composition
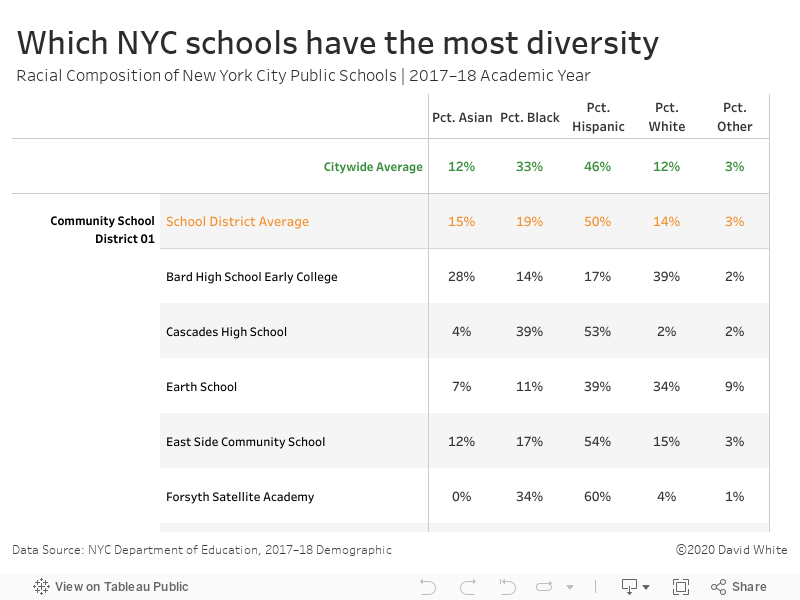
The racial composition of NYC public high schools
David White | Sunday, July 18, 2021
This graphic organizer lists the racial composition of individual NYC public schools. The citywide averages and the school district averages are shown at the top in orange and green respectively. The underlying data was released by the City of New York.
Saturday, July 17, 2021
Education outcomes in NYC public high schools…Read More
Insights, Made Fresh Daily
Results May Vary
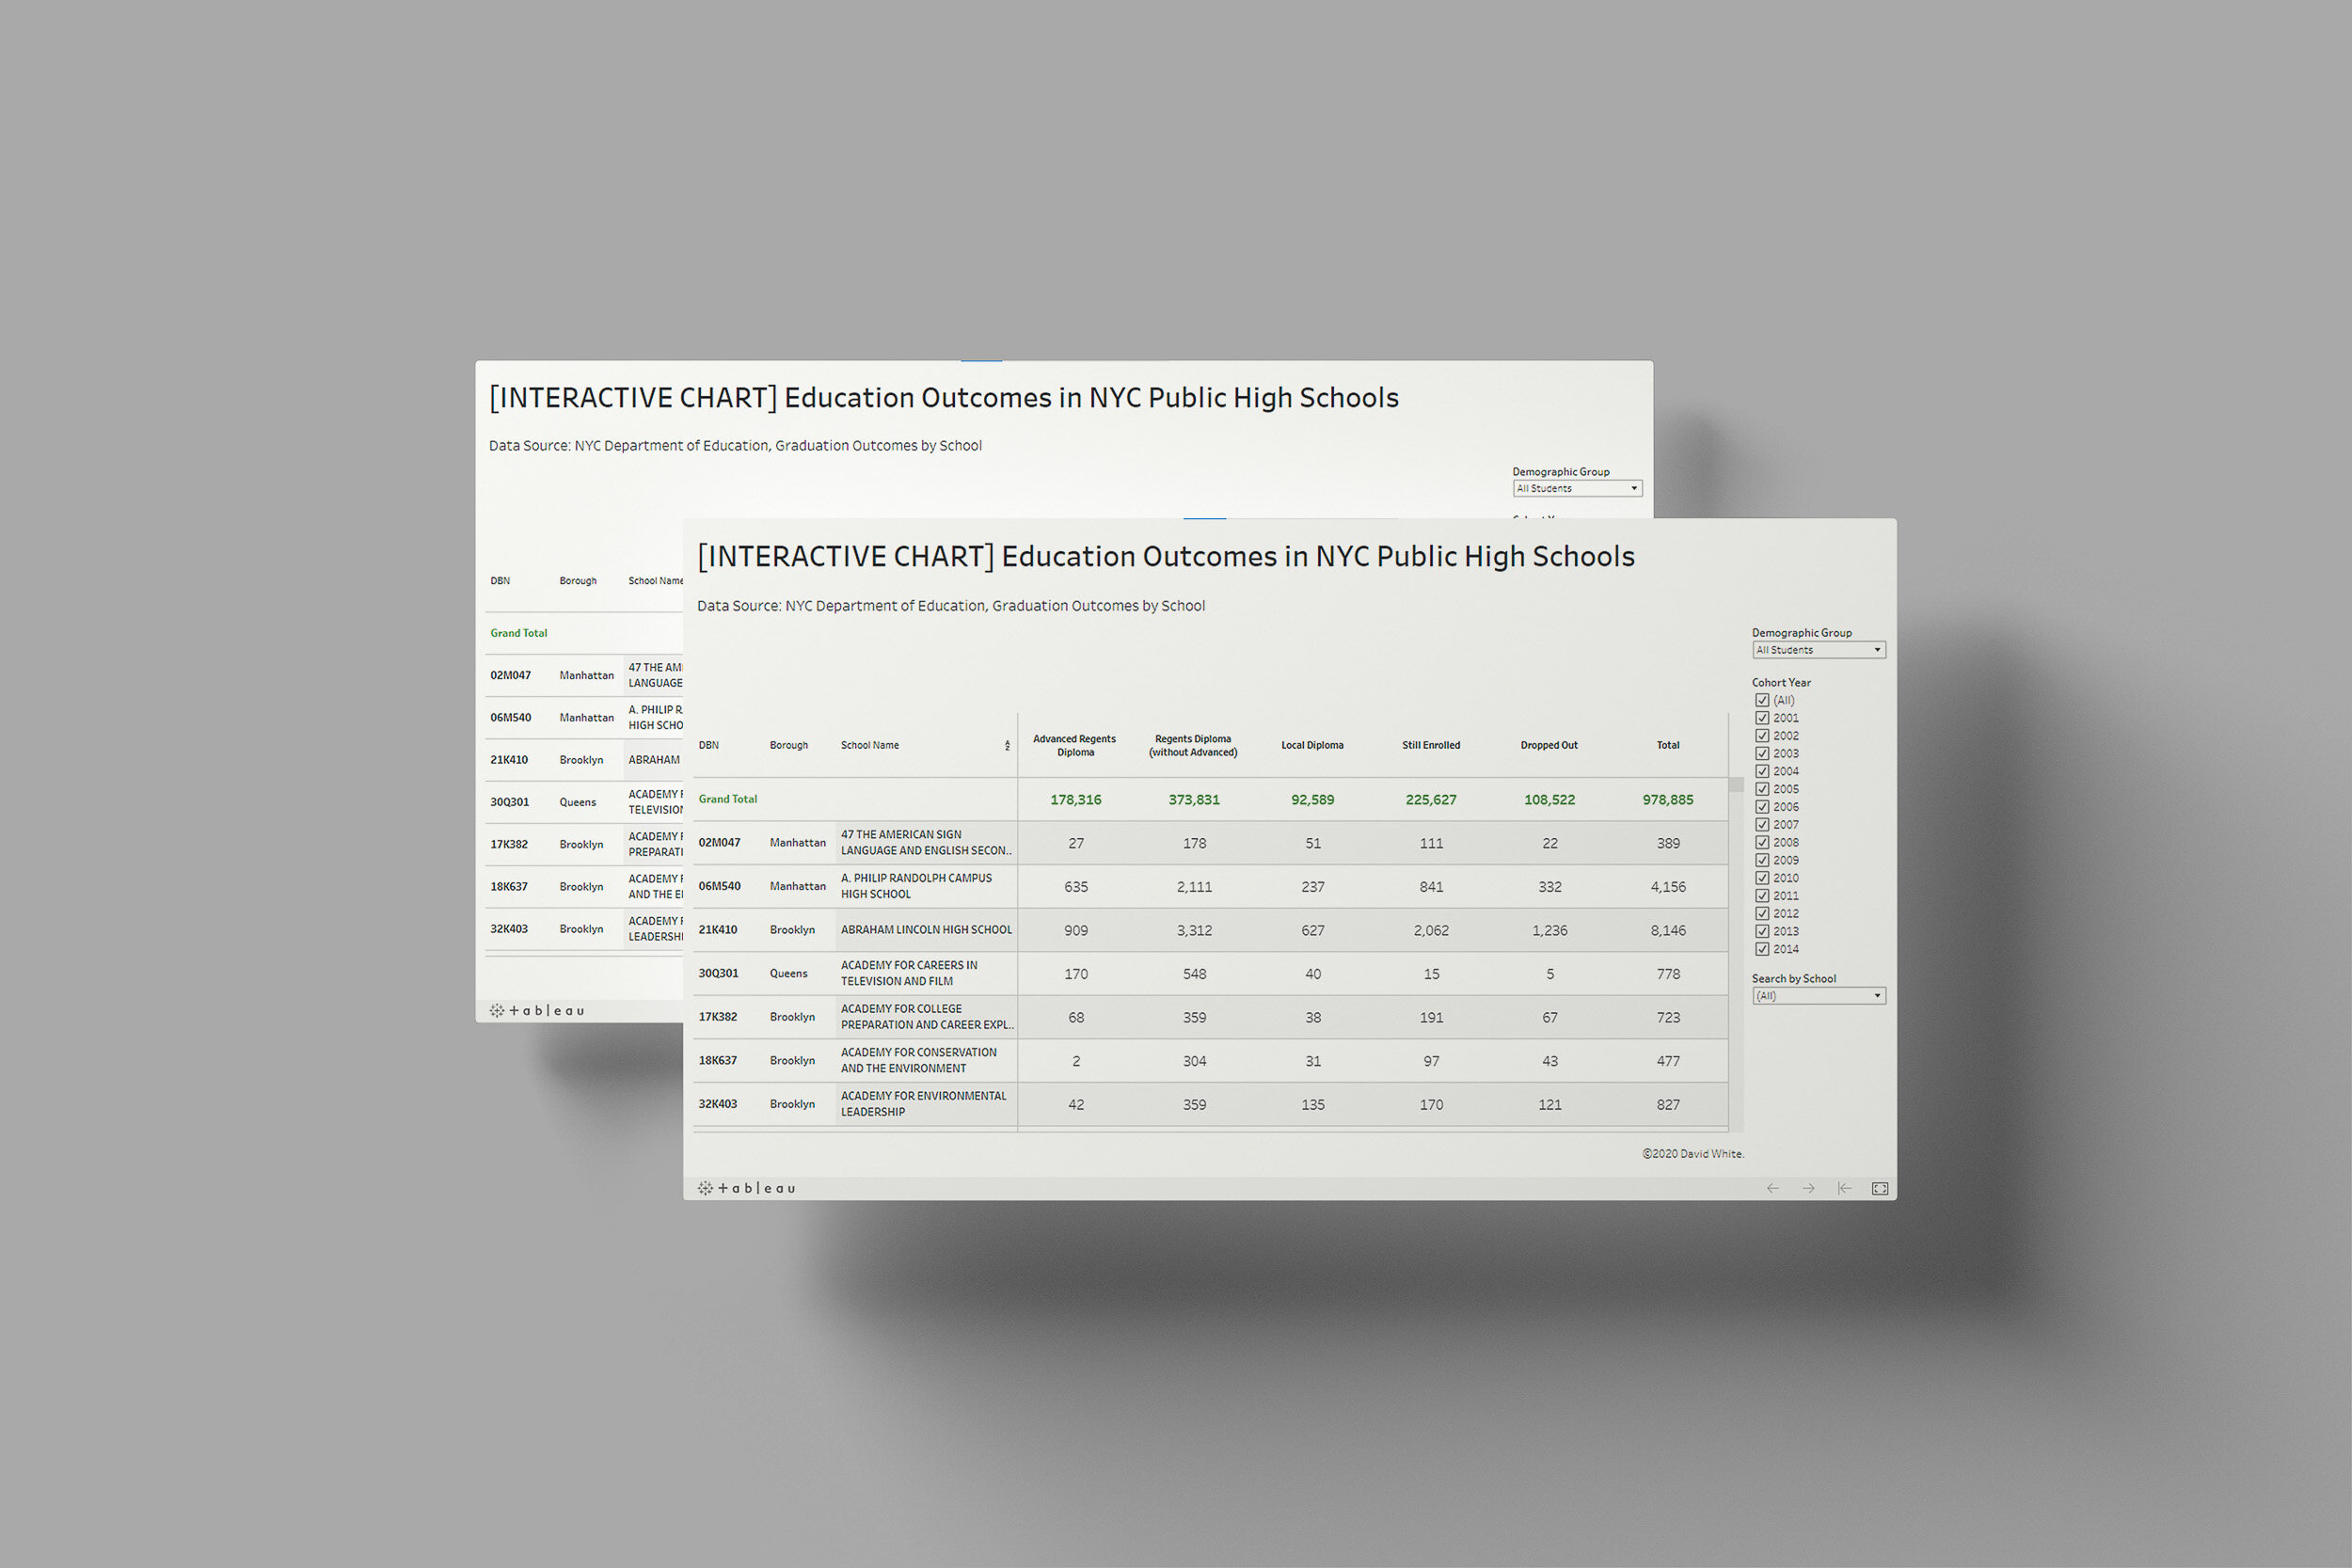
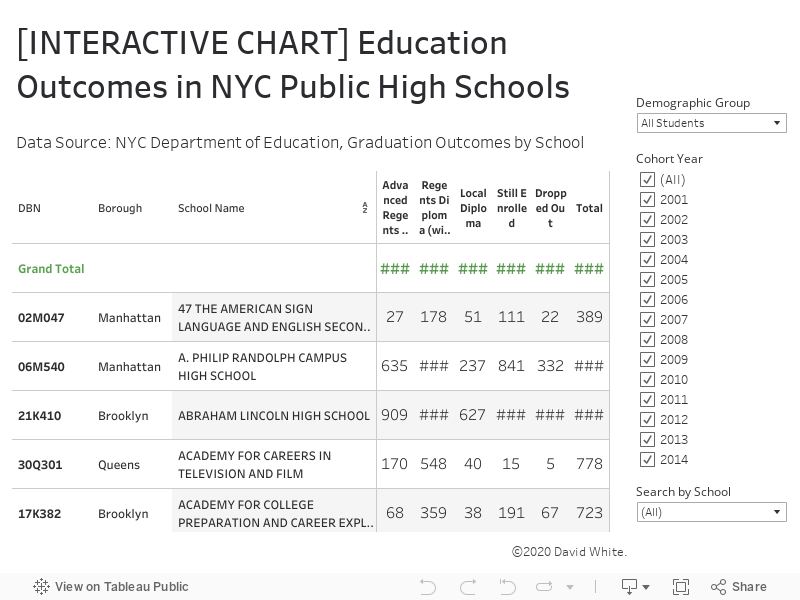
Education outcomes in NYC public high schools
David White | Saturday, July 17, 2021
This dashboard shows the education outcomes (diploma, dropped out or still enrolled) of each NYC public high school. The chart is filterable by cohort year and demographic subgroup. The underlying data was released by the City of New York.

Saturday, July 10, 2021
The secondary school outcomes of NYC students…Read more
Insights, Made Fresh Daily
Futures in Focus
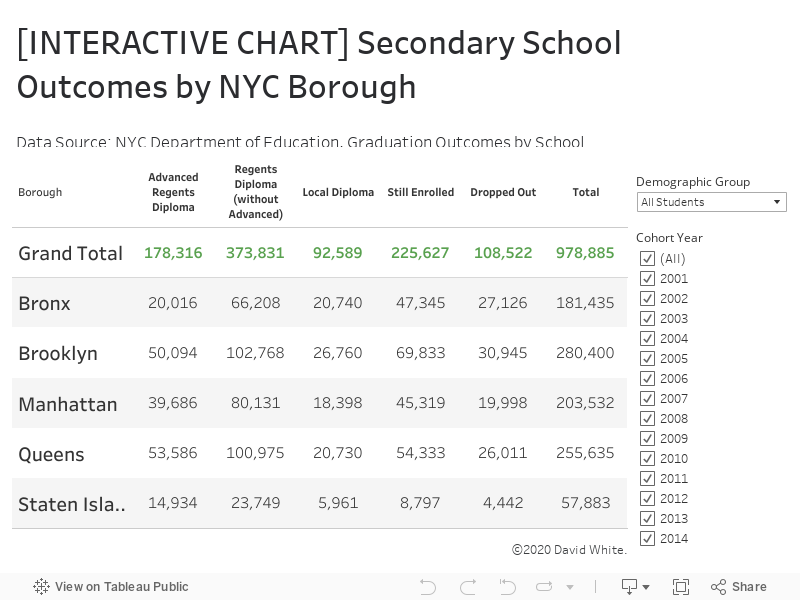
The secondary school outcomes of NYC students
David White | Saturday, July 10, 2021
This graphic organizer shows the recent graduation outcomes of students enrolled in NYC high schools. The chart is filterable and allows you to sort the data by cohort year (the year a student entered 9th grade) and demographic subgroup. The underlying data was released by the City of New York.