

Tuesday, July 6, 2021
The City of New York has its sights set on some lofty goals…Read more
Insights, Made Fresh Daily
Higher Aspirations
The City of New York has its sights set on some lofty goals
David White | Tuesday, July 6, 2021
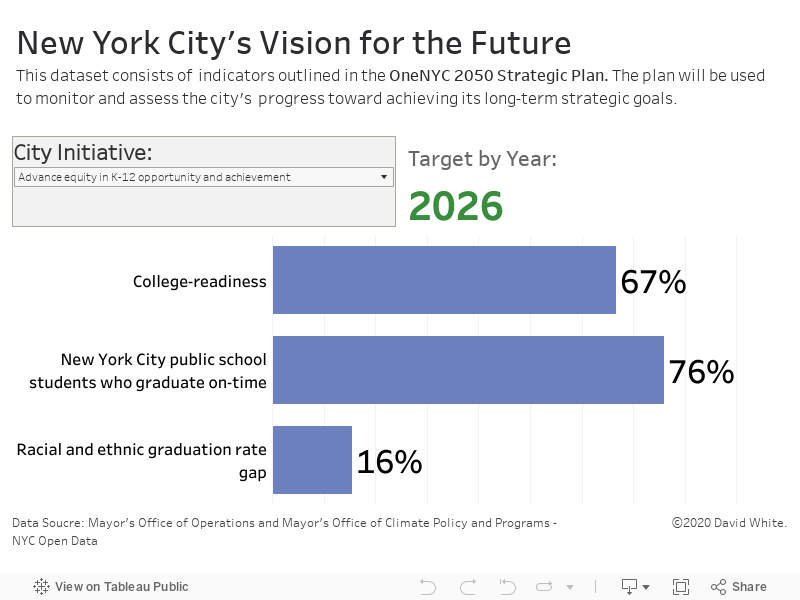
This dashboard shows goals that the government of the City of New York has set for various areas of public life. The underlying data was released by the City of New York.
The interactive data visualization outlines each of goals laid out in the OneNYC 2050 Strategic Plan along with the target numbers the city is trying to achieve and the dates by which they aim to achieve them.

Monday, July 5, 2021
Students entering 9th grade in 2014 took varied paths…Read more
Sankey Diagrams by David White — click images to enlarge


Insights, Made Fresh Daily
What Ever Happened to...Cohort 2014
NYC students entering 9th grade in 2014 took varied paths
David White | Monday, July 5, 2021
This collection of Sankey diagrams illustrates the education outcomes of students who entered 9th grade in 2014, in each of New York City’s boroughs. The underlying data was released by the City of New York.
Some key takeaways from the data:
about 75% of students entering 9th grade in 2014 graduated high school on-time
less than a third of graduates earned advanced diplomas
about 7% of students entering 9th grade in 2014 dropped out of high school
about 15% of students entering 9th grade in 2014 did not graduate on-time (in 4 years) and are still pursuing their diplomas
Sunday, July 4, 2021
2019 New York State Common Core Learning Standard Exam results…Read more
Insights, Made Fresh Daily
Data Explorer
2019 New York State Common Core Learning Standard Exam results
David White | Sunday, July 4, 2021
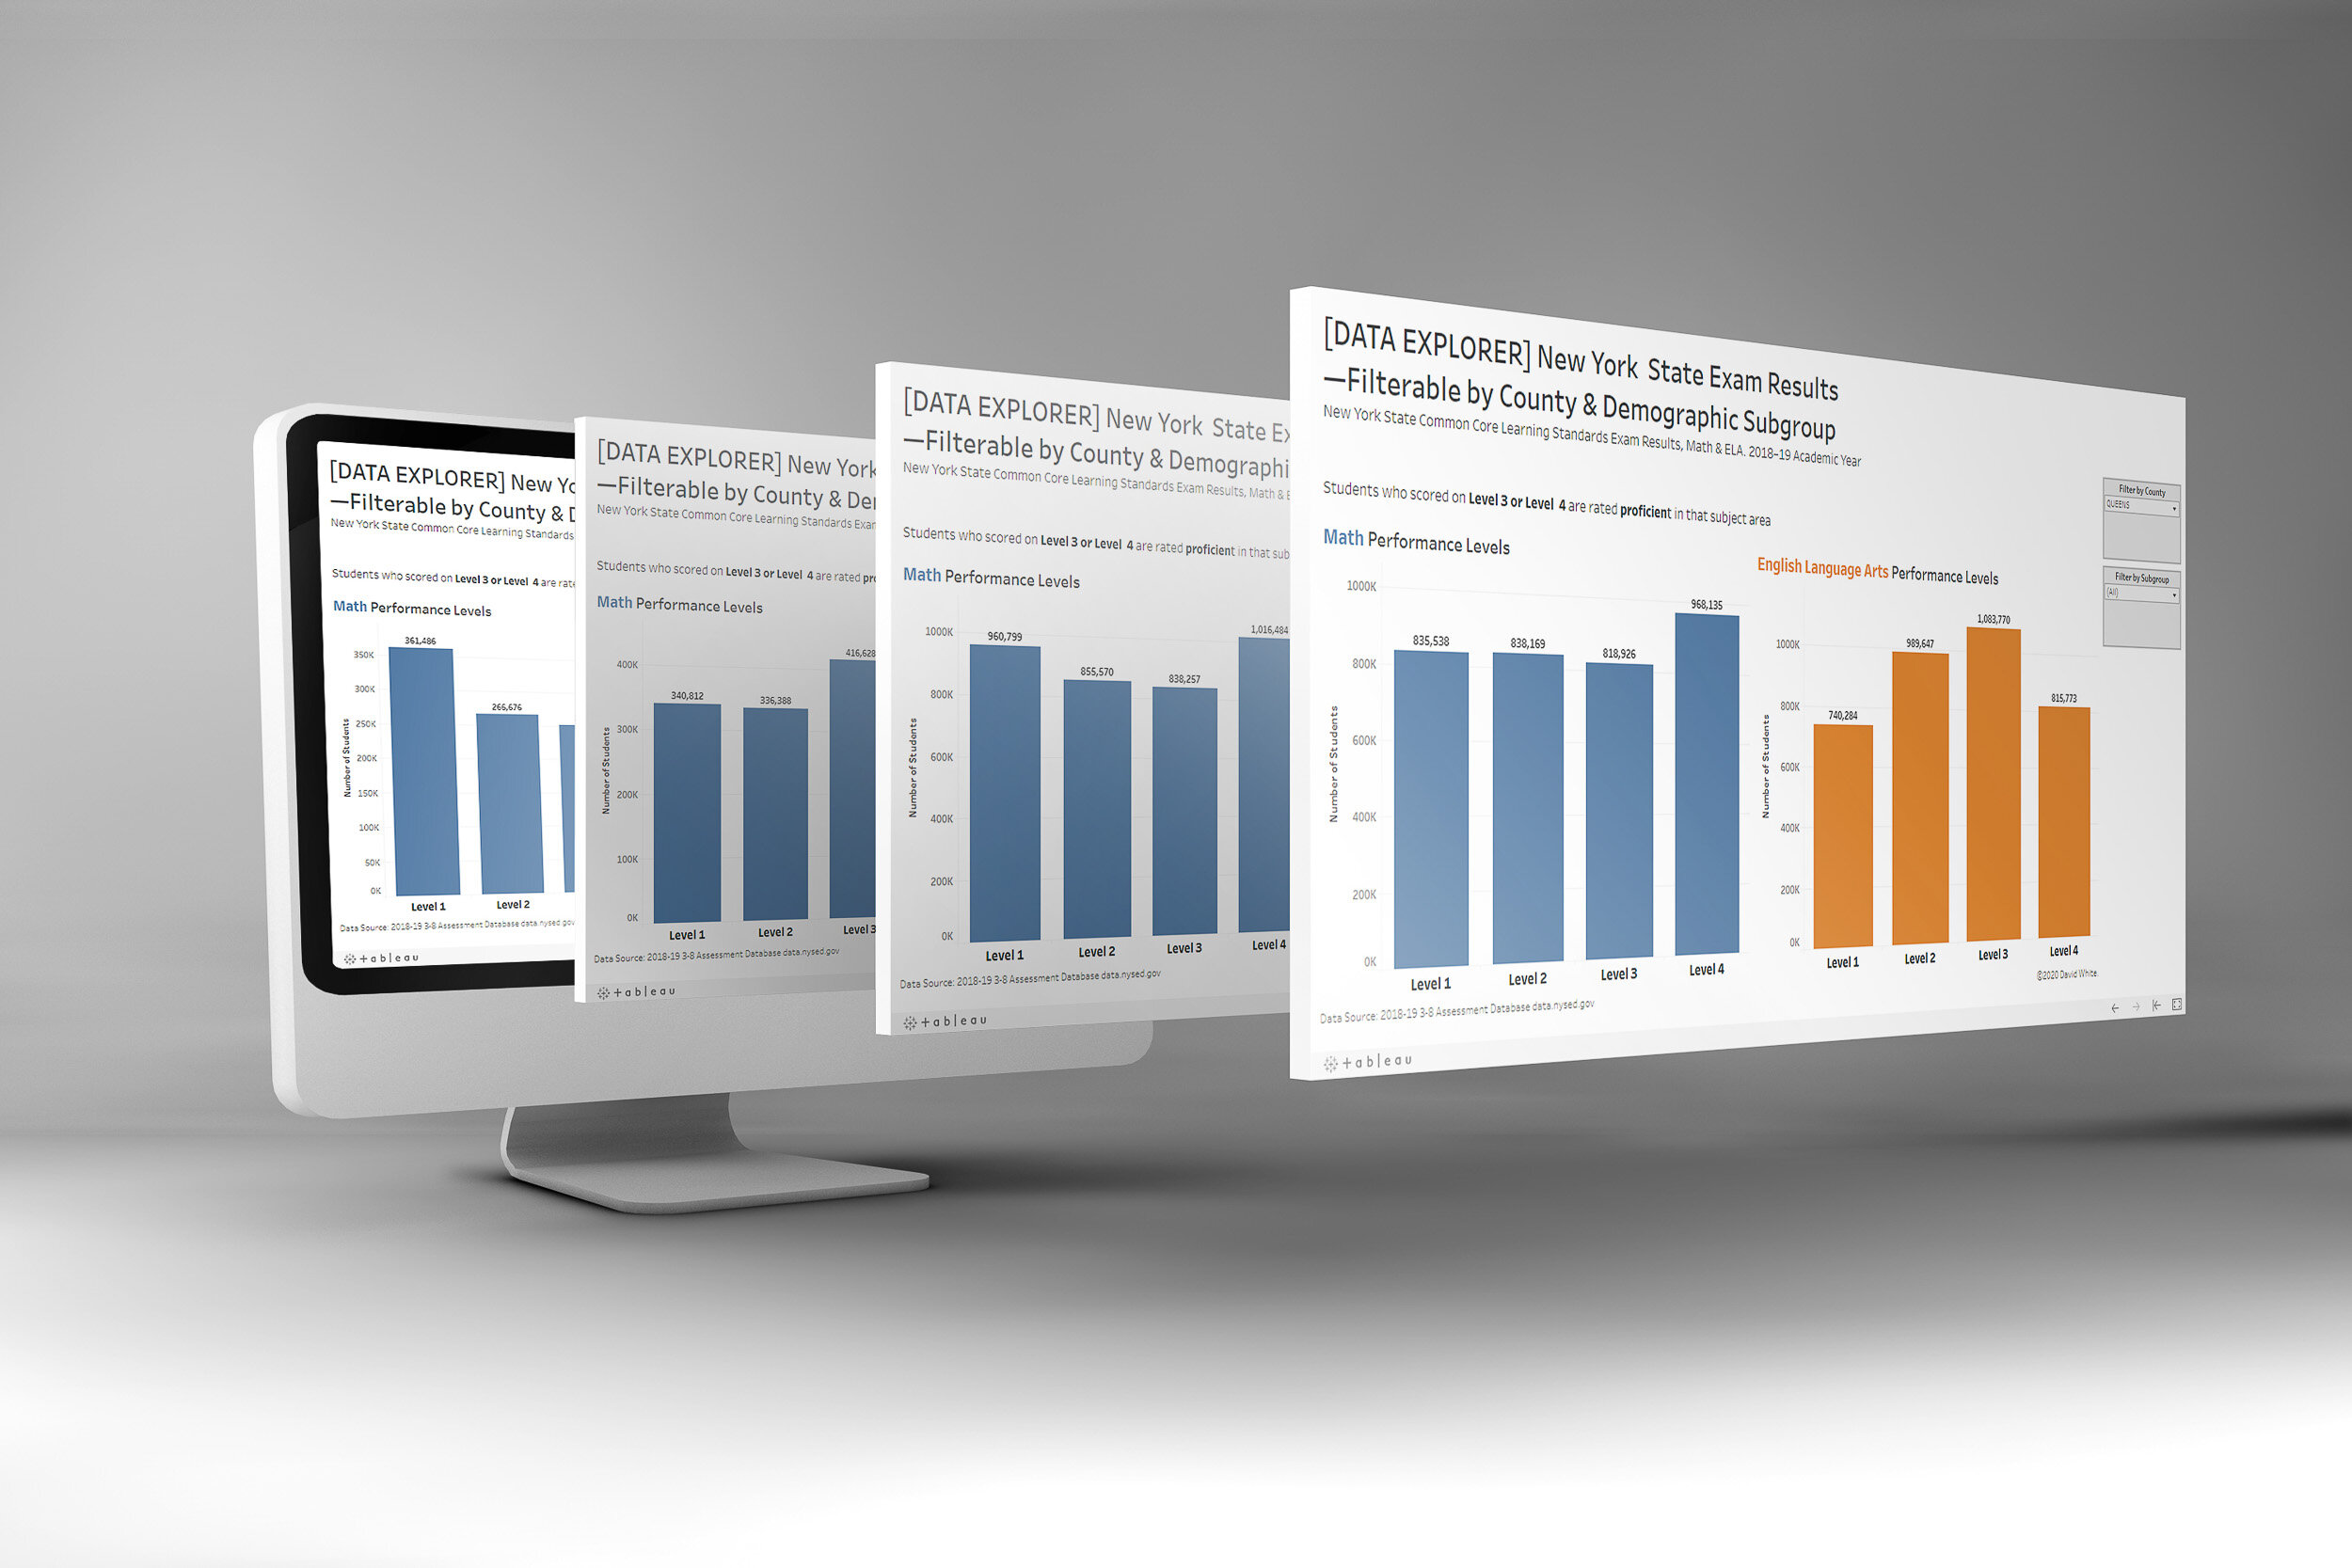
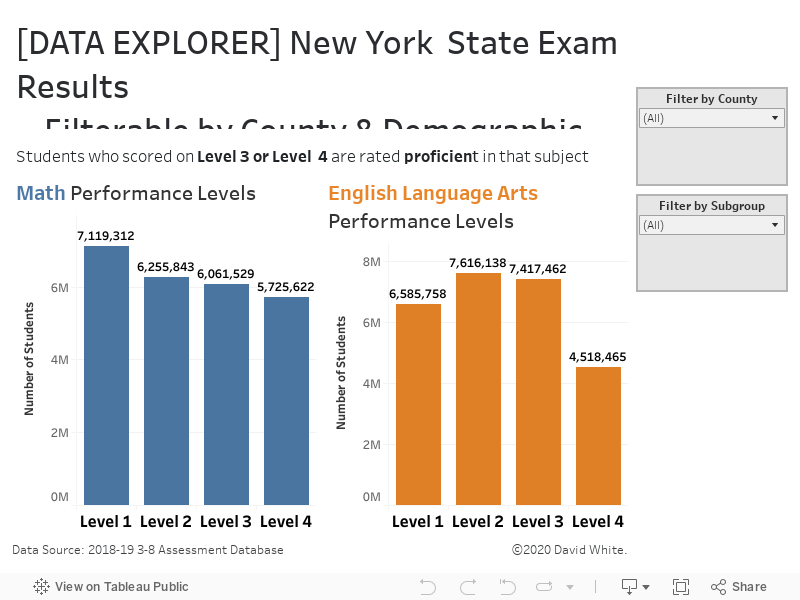
This dashboard shows the results of the 2019 New York State Common Core Learning Standard Exam (NYS CCLS). It displays the English Language Arts (ELA) and Math exam scores of New York City public school students in Grades 3–8. The dashboard is filterable by county and demographic subgroup. The underlying data was released by the New York State Education Department (NYSED).
Saturday, July 3, 2021
How NYC high schools measure up in comparison to their peers…Read more
Insights, Made Fresh Daily
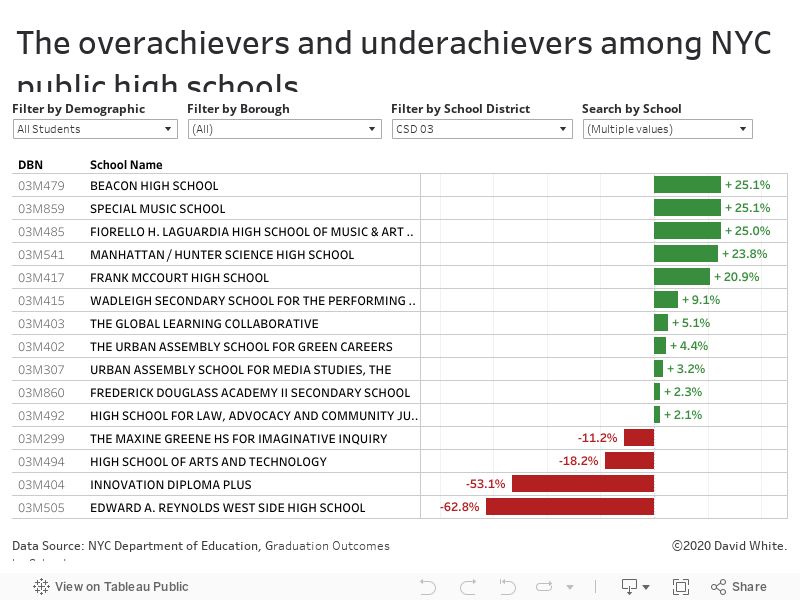
Standing Out
How NYC high schools measure up in comparison to their peers
David White | Saturday, July 3, 2021
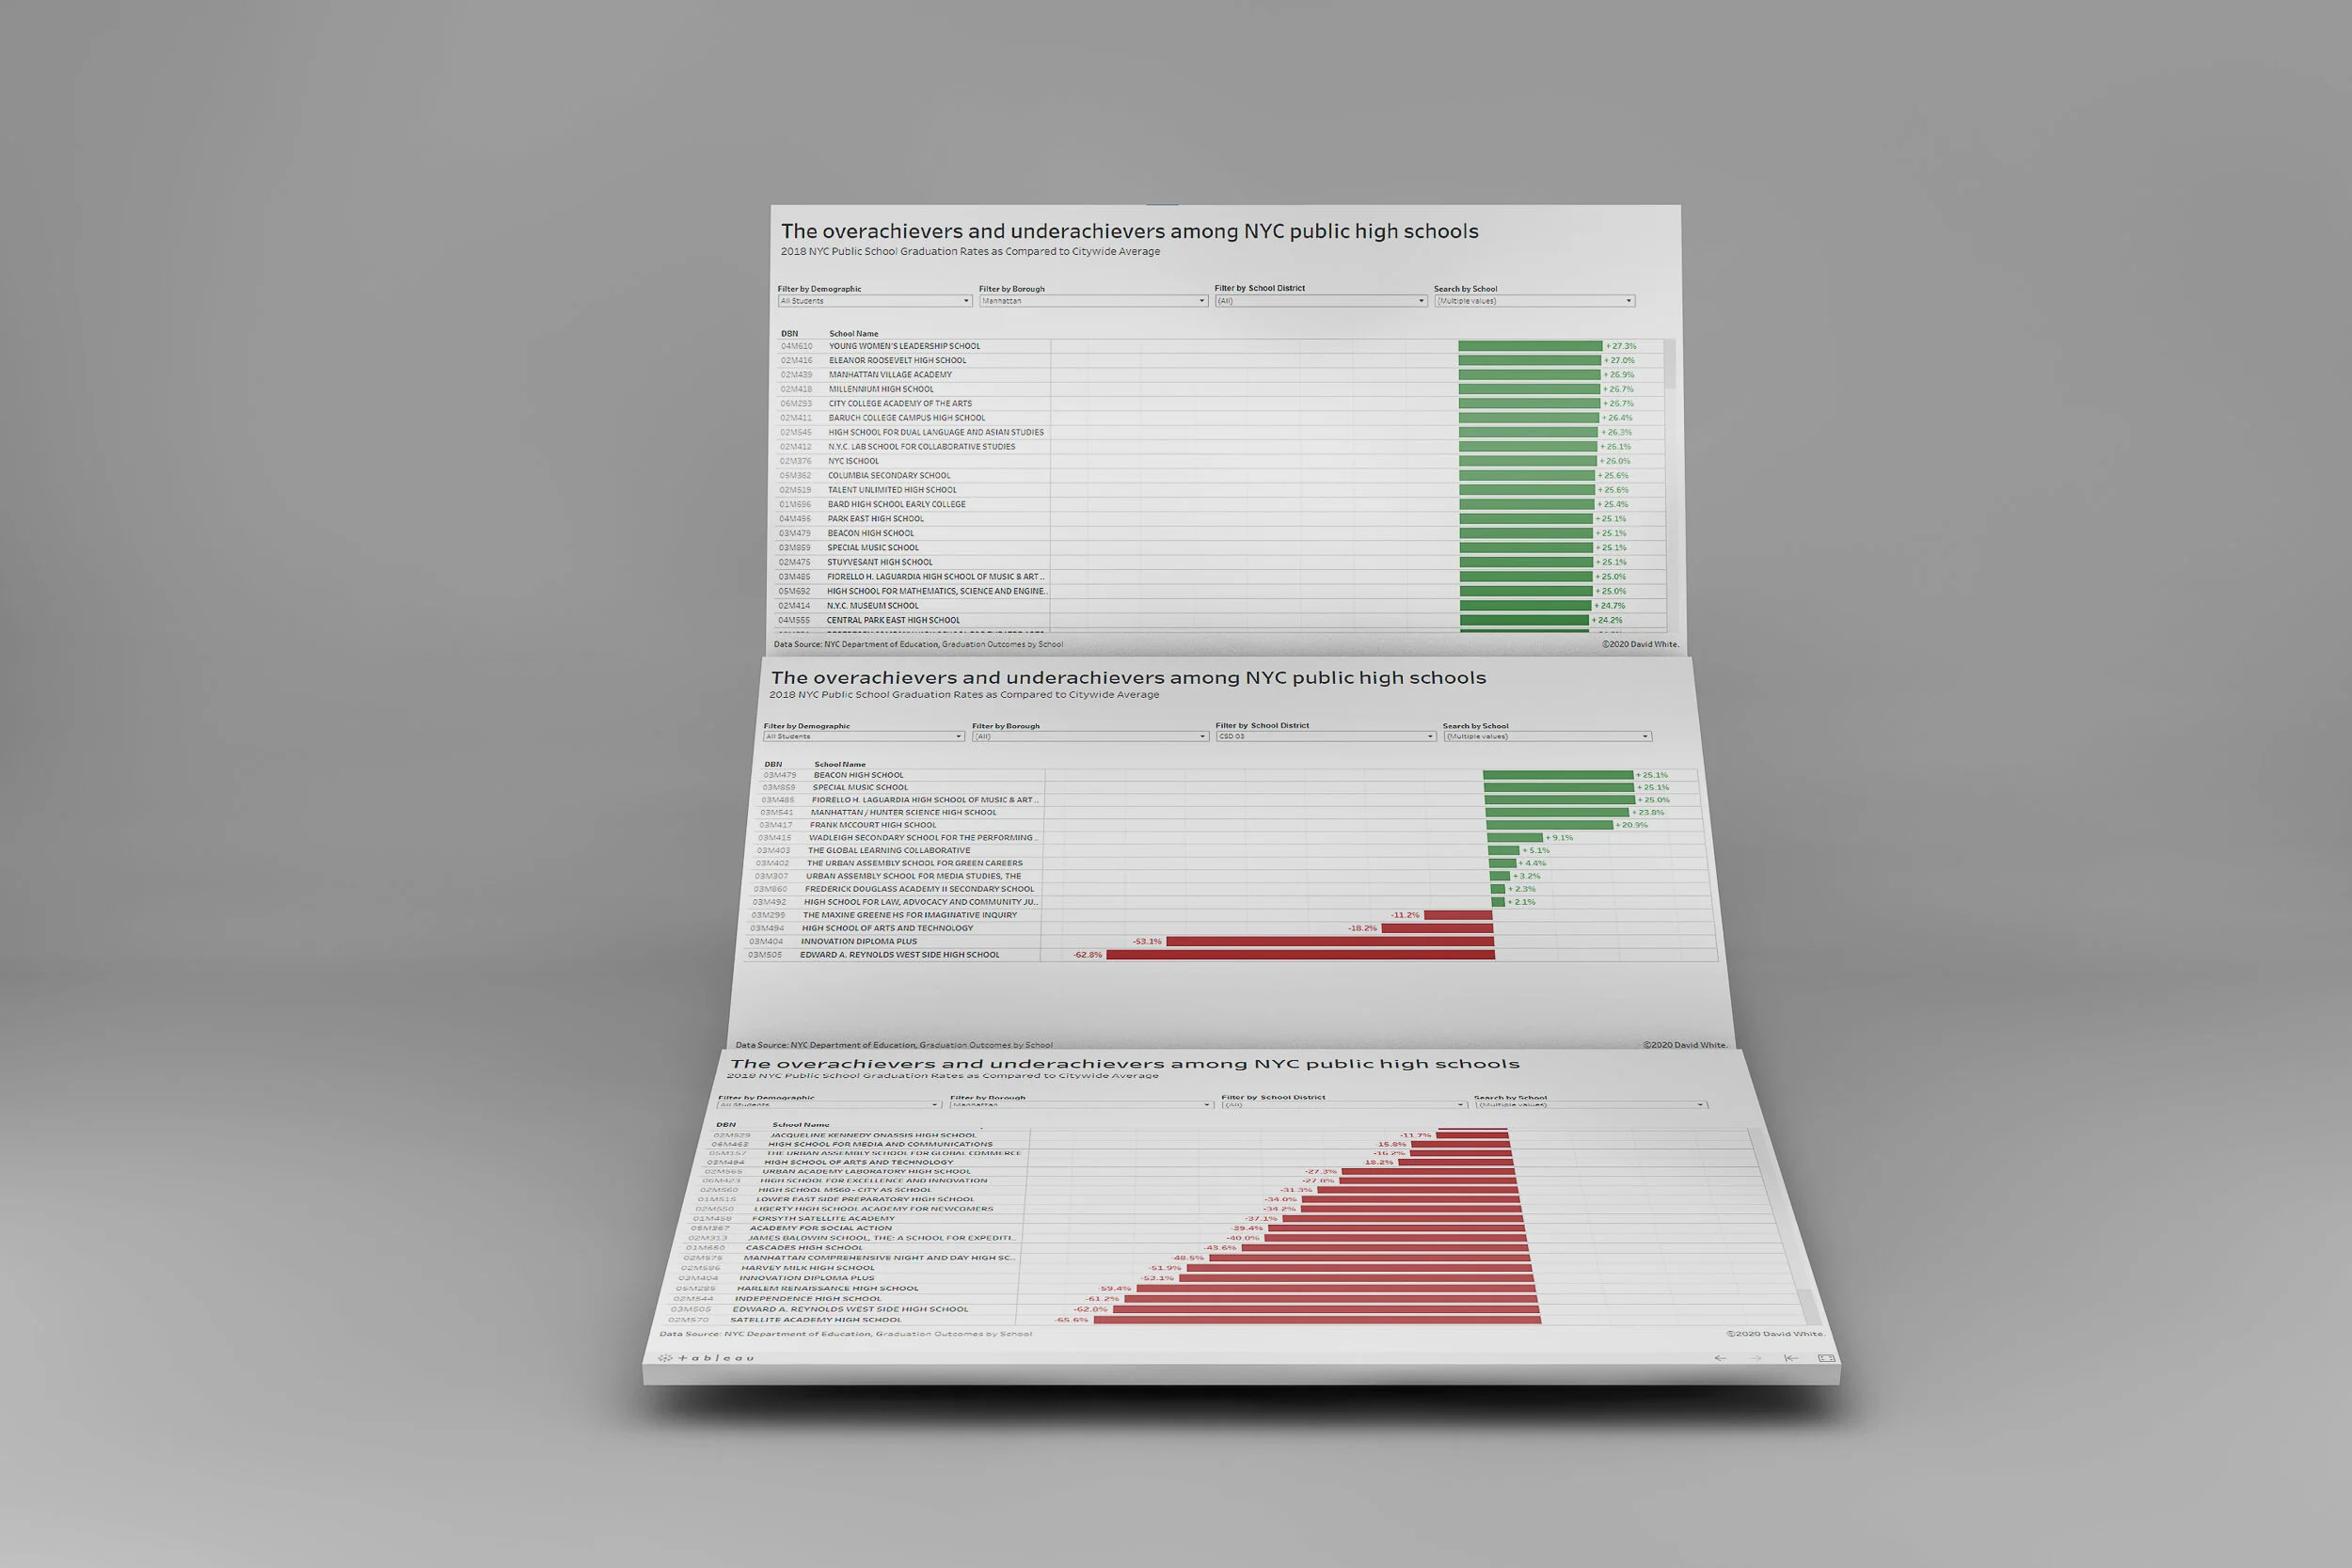
This bar graph shows the graduation rates of NYC high schools in 2018 and how much each school’s graduation rate deviated from the citywide average. The interactive data graphic is filterable by borough, school district and demographic subgroup. The underlying data was released by the City of New York.
Friday, July 2, 2021
Counterintuitively, student-to-teacher ratios were not a reliable predictor of exam success…Read More
Insights, Made Fresh Daily
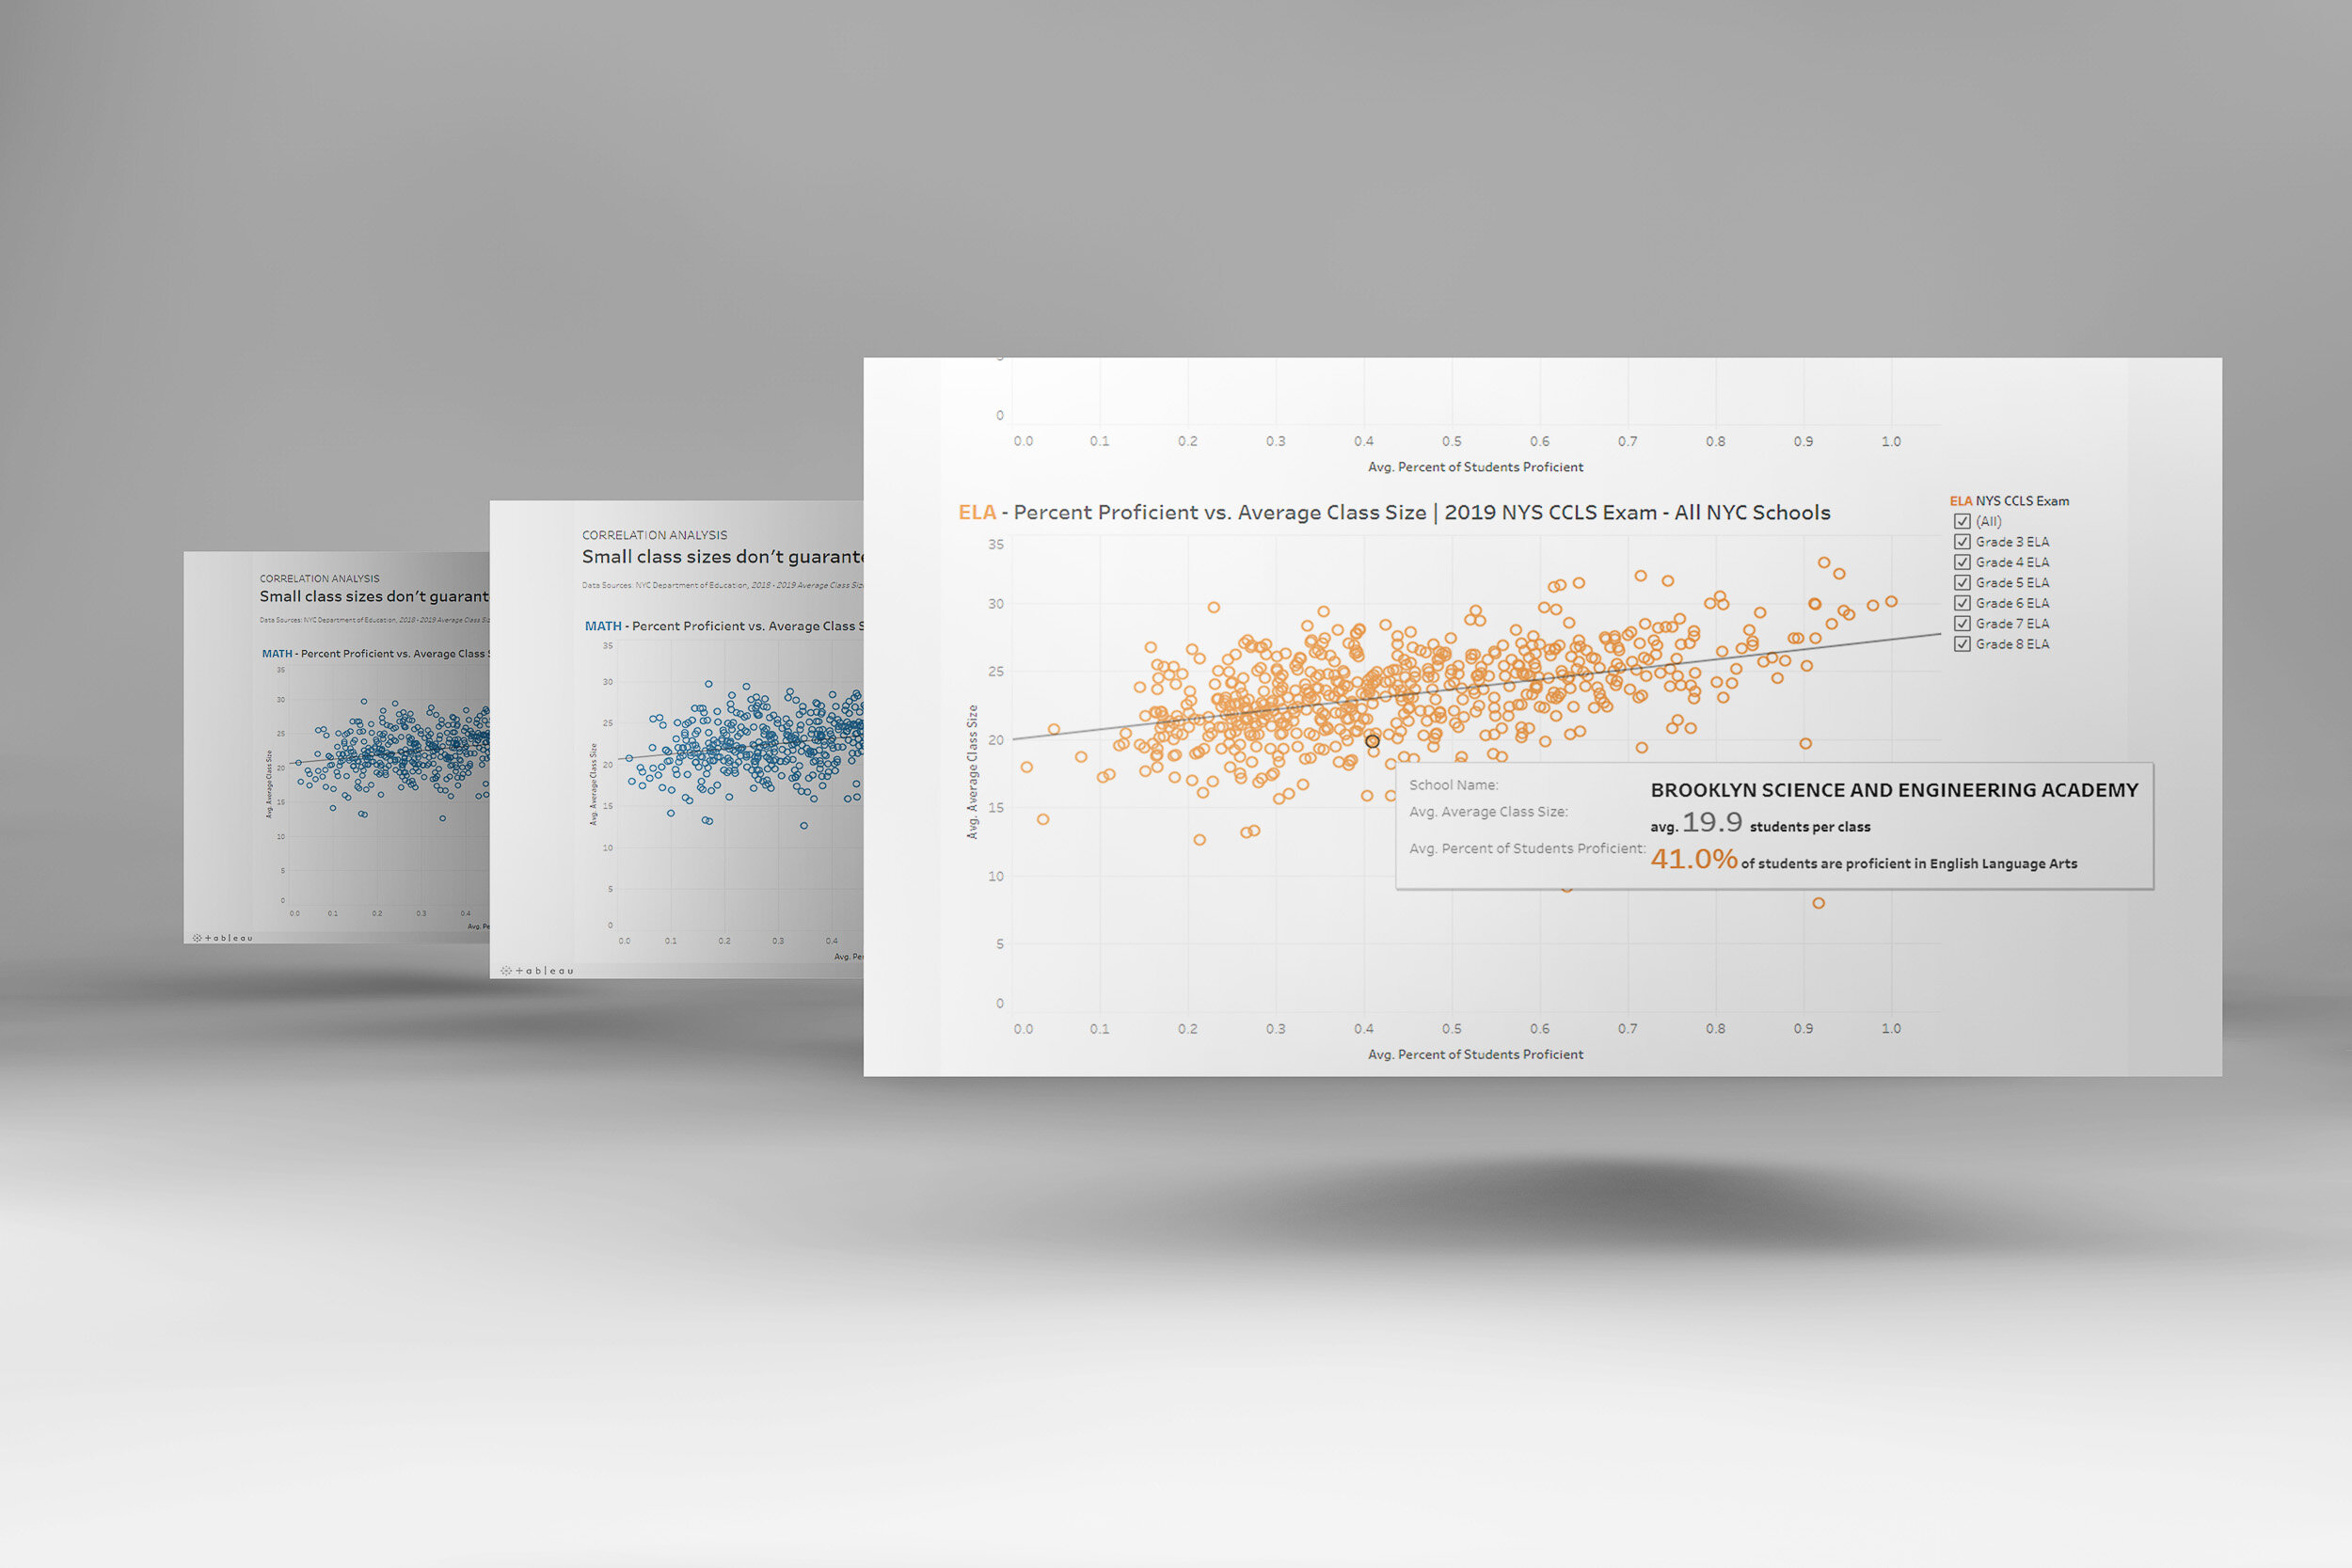
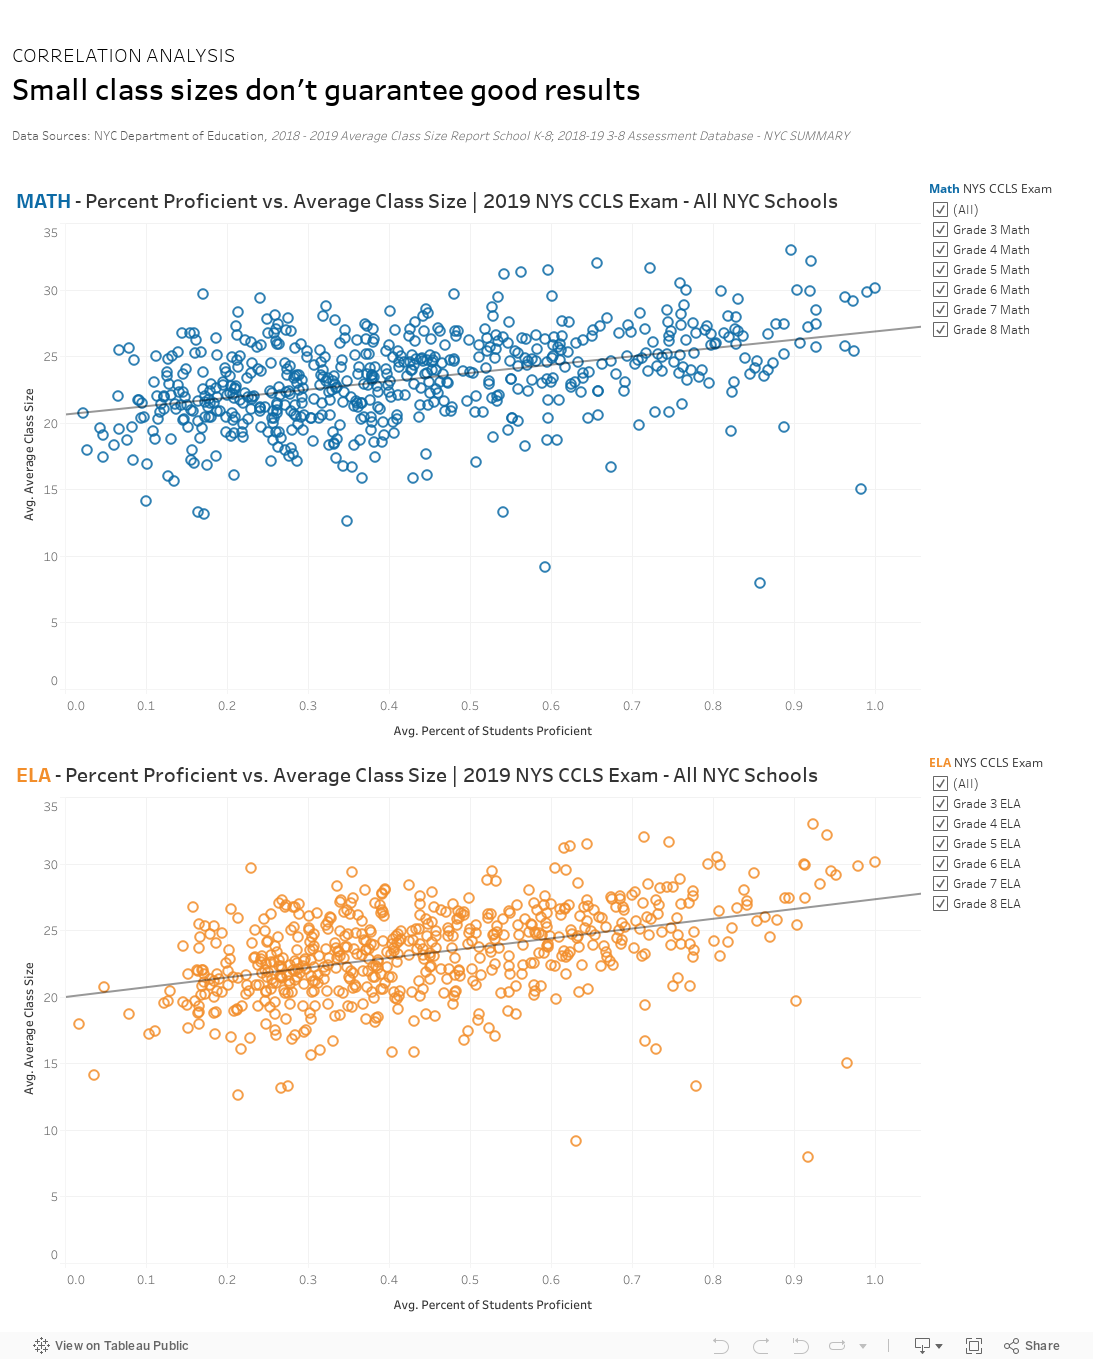
Some Unexpected Results
Counterintuitively, student-to-teacher ratios were not a reliable predictor of exam success
David White | Friday, July 2, 2021
This scatterplot shows the relationship between NYC schools’ average class size and their state exam results. The underlying data was released by the New York State Education Department (NYSED).
The data graphic shows the English Language Arts (ELA) and Math exam scores of New York City public school students in Grades 3–8. While there was a small amount of correlation between small class sizes and high exam marks, there were in fact many examples where schools with large class sizes earned high scores. Conversely, there were also several schools with small class sizes who did not perform as well as their peers.

Thursday, July 1, 2021
New York City’s high schools are producing more graduates In recent years…Read More
Insights, Made Fresh Daily
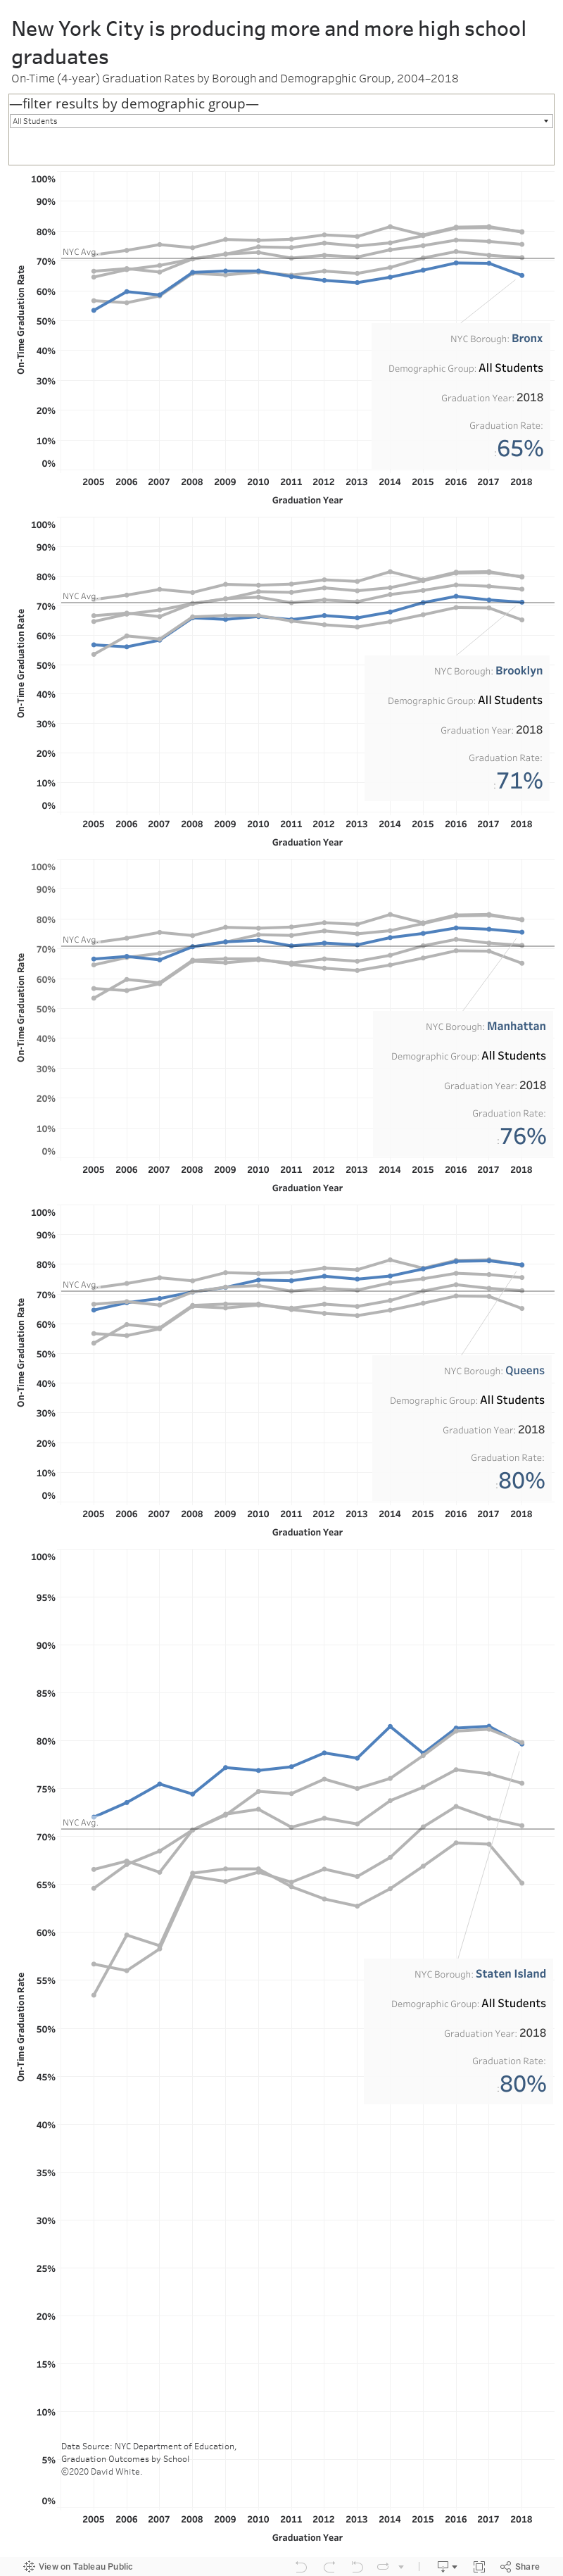
Upward Bound
New York City’s high schools are producing more graduates In recent years
David White | Thursday, July 1, 2021
This line graph illustrates the recent trends in NYC high school graduation rates. The underlying data was released by the City of New York.
The data graphic shows the graduation rates of New York City high school students between the years of 2004 and 2018. During that stretch of time, the average gradation rate citywide was 71%. Looking at the 14-year time period as a whole, the NYC graduation rates are trending upward.