

Case Study 013. Jazzfuel.com COVID-19 Survey Results Visualization: Step 1
Step 1 - Discovery
My very first step was to meet with the client and determine what his needs were for the project.
From our conversation, I learned that his goal was to create a visual that:
quickly summarized the survey’s key points of information
could be posted online and shared via his email newsletter
allowed users to filter the data by demographic subgroup (location, age, etc.)
stimulated further discussion amongst members of the community

Jazzfuel Dashboard: Work Process Step 1 of 5
Step 1 - Discovery
My very first step was to meet with the client and determine what his needs were for the project.
From our conversation, I learned that his goal was to create a visual that:
quickly summarized the survey’s key points of information
could be posted online and shared via his email newsletter
allowed users to filter the data by demographic subgroup (location, age, etc.)
stimulated further discussion amongst members of the community

Case Study 013. Jazzfuel.com COVID-19 Survey Results Visualization: Step 2
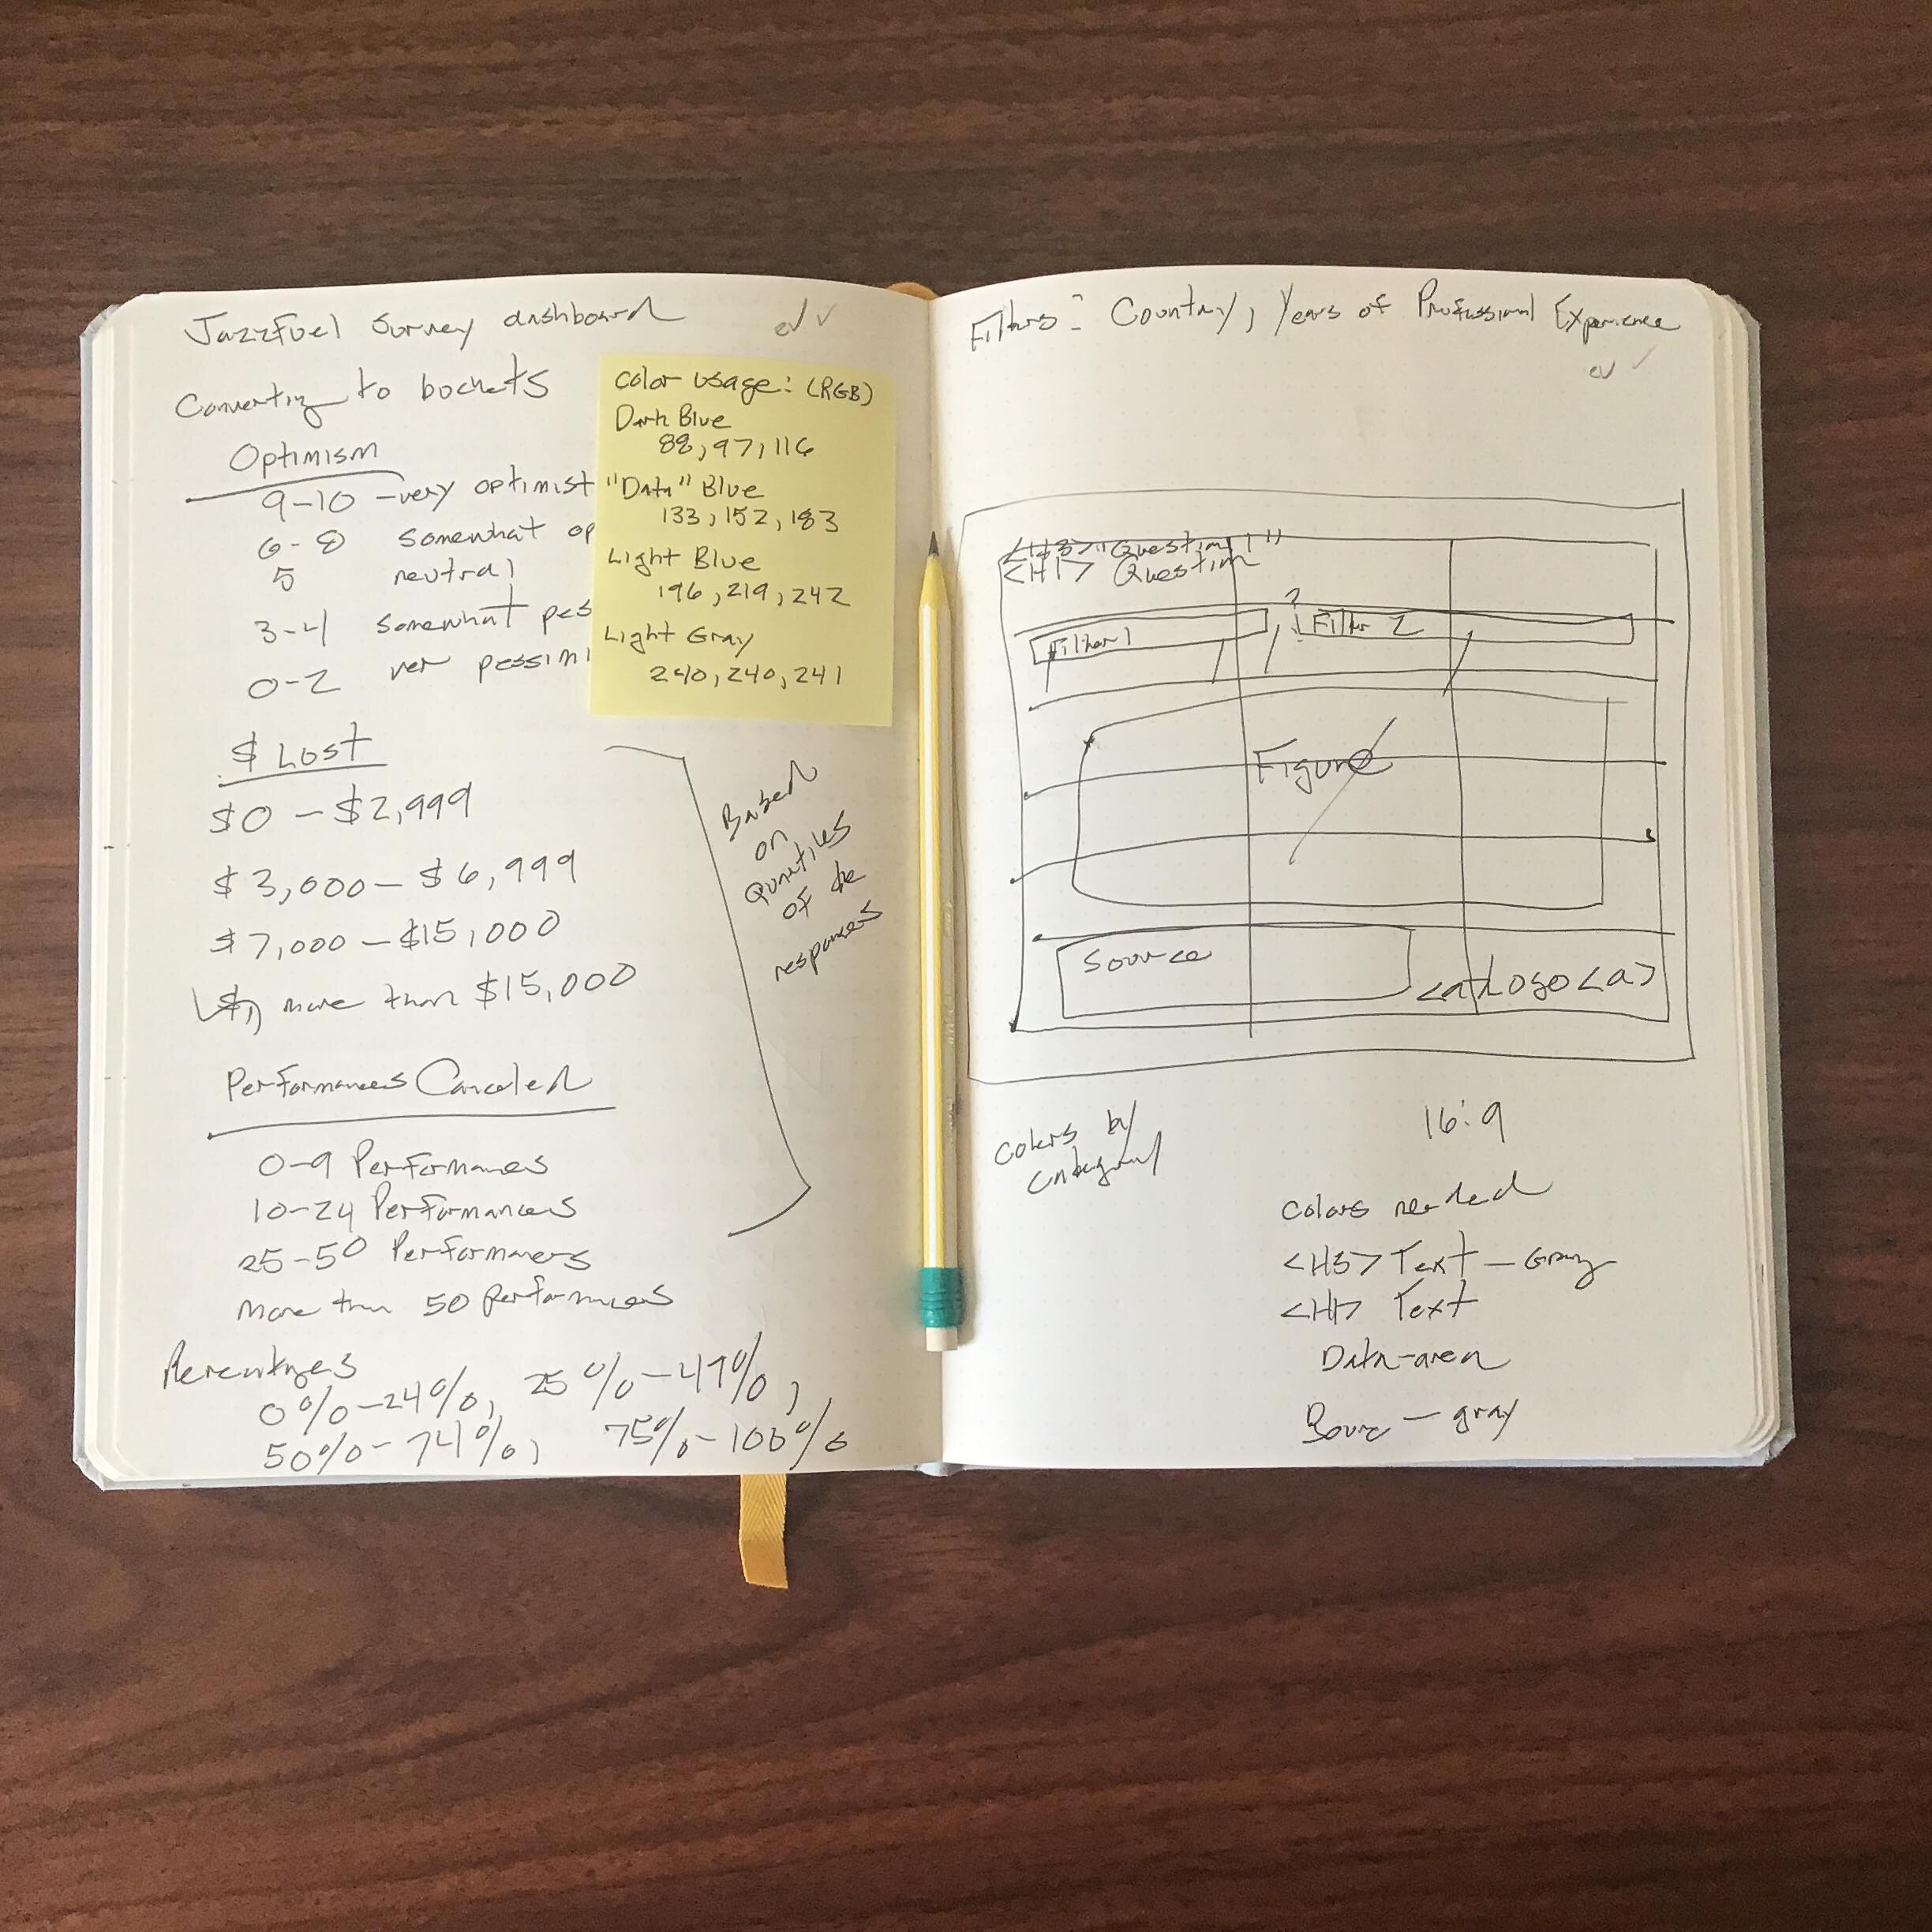
Step 2 - Sketch
Next, I made a rough sketch of what the visualizaion would look like and what information would go where on the screen.
Jazzfuel Dashboard: Work Process Step 2 of 5
Step 2 - Sketch
Next, I made a rough sketch of what the visualization would look like and what information would go where on the screen.

Case Study 013. Jazzfuel.com COVID-19 Survey Results Visualization: Step 3
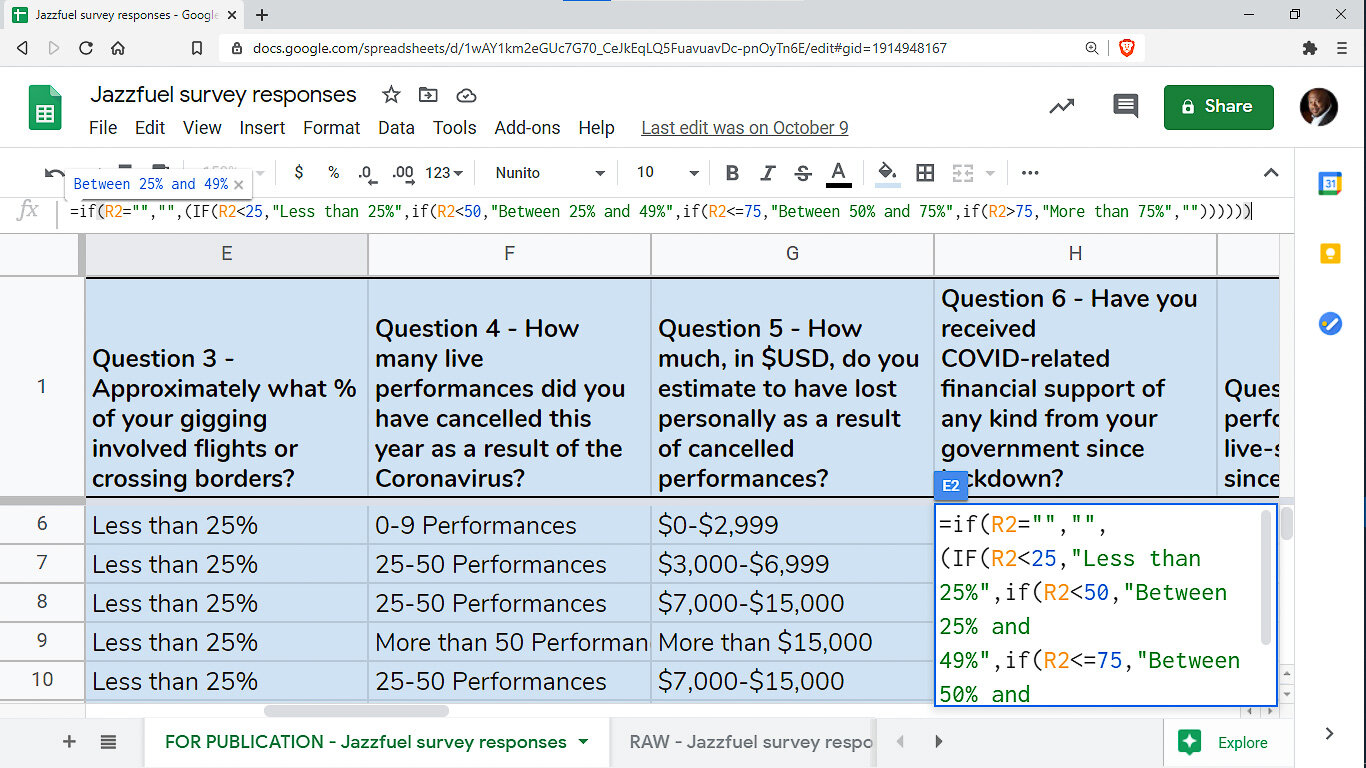
Step 3 - Prep Data
I took the granular, row-by-row data from the survey responses and I organized it in a way that would allow it to be translated into clear visuals.
Jazzfuel Dashboard: Work Process Step 3 of 5
Step 3 - Prep Data
I took the granular, row-by-row data from the survey responses and I organized it in a way that would allow it to be translated into clear visuals.
Case Study 013. Jazzfuel.com COVID-19 Survey Results Visualization: Step 4
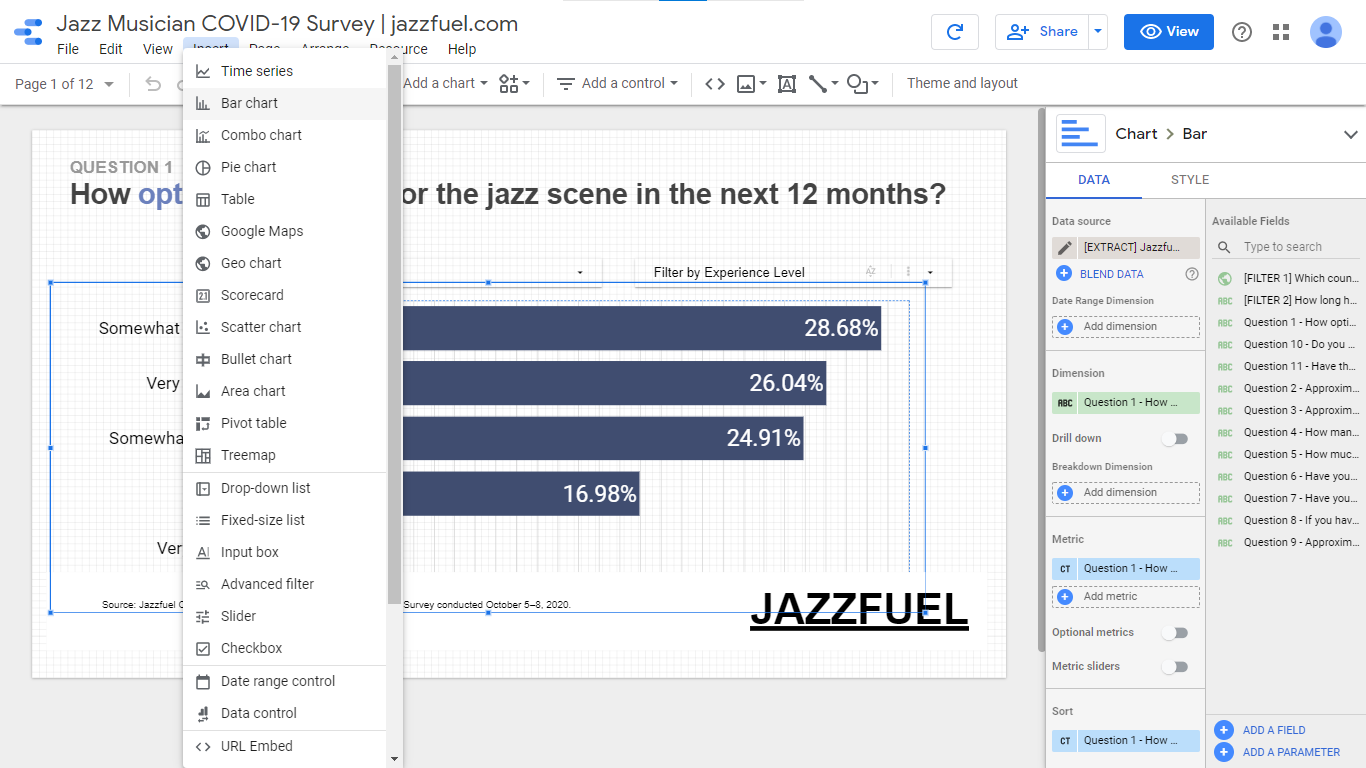
Step 4 - Build
To build out the visualization, I chose to use Google Data Studio. I chose Data Studio because it can easily be shared (via a link) and/or embedded into a website.

Jazzfuel Dashboard: Work Process Step 4 of 5
Step 4 - Build
To build out the visualization, I chose to use Google Data Studio. I chose Data Studio because it can easily be shared (via a link) and/or embedded into a website.

Case Study 013. Jazzfuel.com COVID-19 Survey Results Visualization: Step 5
Step 5 - Publish
Once I finished building out the visualization and connecting it to the data source, I published the visualization and shared it online.

Jazzfuel Dashboard: Work Process Step 5 of 5
Step 5 - Publish
Once I finished building out the visualization and connecting it to the data source, I published the visualization and shared it online.