
Case Study 013. Jazzfuel.com COVID-19 Survey Results Visualization: Step 3
Jazzfuel Dashboard: Work Process Step 3 of 5
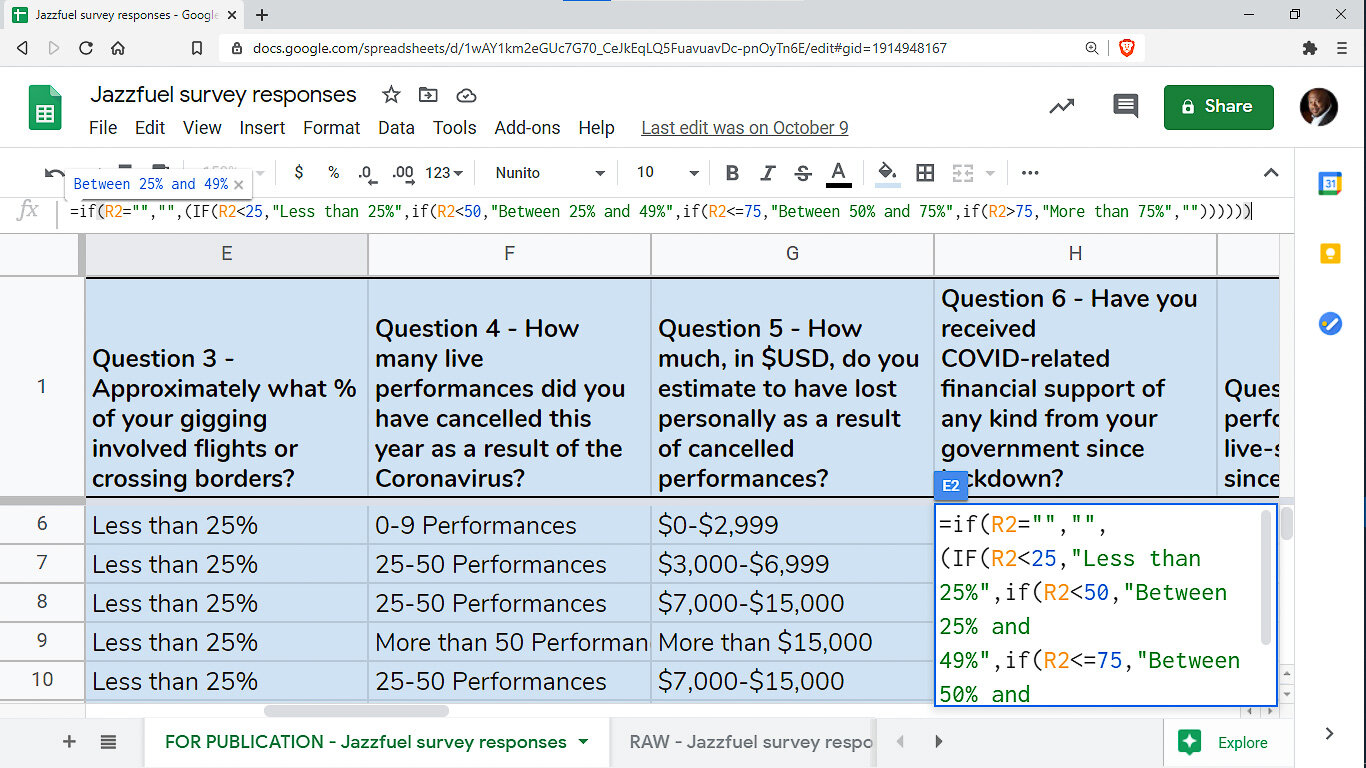
Step 3 - Prep Data
I took the granular, row-by-row data from the survey responses and I organized it in a way that would allow it to be translated into clear visuals.