

Case Study 011. South Asian Youth Action (SAYA!) Mentor Summaries: Step 3
Step 3 - Prep Data
I identified the sources of information needed to make the reports and I began collecting the raw data. Since this was a report that would have to be updated on a weekly basis, I made sure to organize the data files in such a way that they could be updated quickly. I had to ensure that all of the columns for each category of data would line up exactly, every time.

SAYA Mentor Summary Reports: Work Process Step 3 of 5
Step 3 - Prep Data
I identified the sources of information needed to make the reports and I began collecting the raw data. Since this was a report that would have to be updated on a weekly basis, I made sure to organize the data files in such a way that they could be updated quickly. I had to ensure that all of the columns for each category of data would line up exactly, every time.

Case Study 011. South Asian Youth Action (SAYA!) Mentor Summaries: Step 5
Step 5 - Publish
Having finished the design and build out process, I moved on to producing the individualized reports. At each team meeting, I printed out a hard copy report for each mentor. The entire report fit on a single sheet of paper (printed front and back). I also emailed them a PDF soft copy. All of the information on each mentor’s report was specific to the mentees in their own caseload. Throughout the school day, the mentors held one-on-one meetings with their mentees. During these meetings, mentors often referred directly to to the printed reports I had produced for them. The mentors told me that the new reports were very helpful to them in communicating with their mentees and keeping them focused on their goals.

SAYA Mentor Summary Reports: Work Process Step 5 of 5
Step 5 - Publish
Having finished the design and build out process, I moved on to producing the individualized reports. At each team meeting, I printed out a hard copy report for each mentor. The entire report fit on a single sheet of paper (printed front and back). I also emailed them a PDF soft copy. All of the information on each mentor’s report was specific to the mentees in their own caseload. Throughout the school day, the mentors held one-on-one meetings with their mentees. During these meetings, mentors often referred directly to to the printed reports I had produced for them. The mentors told me that the new reports were very helpful to them in communicating with their mentees and keeping them focused on their goals.

Case Study 005. South Asian Youth Action (SAYA!) Weather vs. Attendance Tracker: Step 4
Step 4 - Build
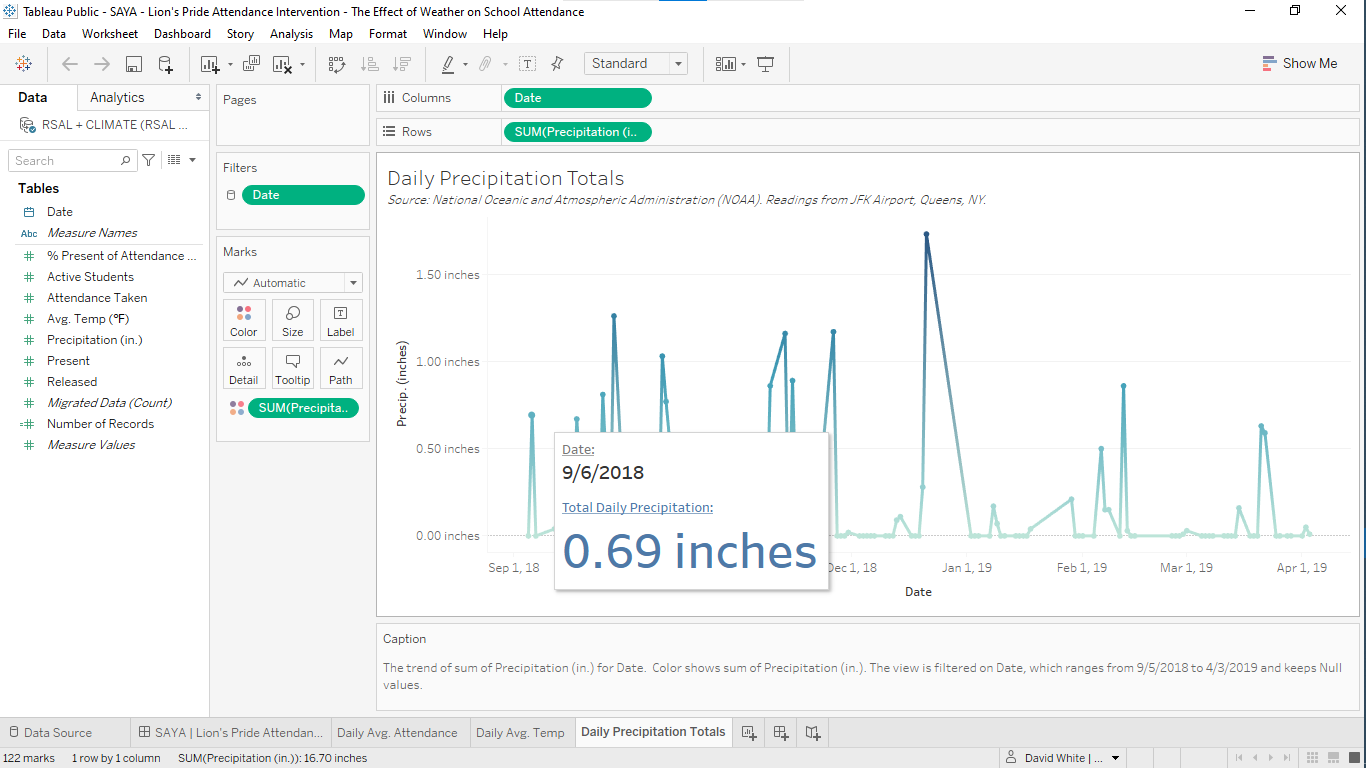
I built out the visualization using Tableau software. The final result would be projected on a large screen during the team’s weekly meeting and I felt that Tableau was the the best choice for that type of presentation.
SAYA Attendance vs. Weather: Work Process Step 4 of 5
Step 4 - Build
I built out the visualization using Tableau software. The final result would be projected on a large screen during the team’s weekly meeting and I felt that Tableau was the the best choice for that type of presentation.

Case Study 005. South Asian Youth Action (SAYA!) Weather vs. Attendance Tracker: Step 5
Step 5 - Publish
I published the finished visualization to Tableau online and I shared it with program administrators via secure link. During the team meeting, the visualization was projected on a large screen locatd at the front of the room. The visualization provided a common point of reference for the mentors and it was used to frame the conversation about their intervention work.

SAYA Attendance vs. Weather: Work Process Step 5 of 5
Step 5 - Publish
I published the finished visualization to Tableau online and I shared it with program administrators via secure link. During the team meeting, the visualization was projected on a large screen locatd at the front of the room. The visualization provided a common point of reference for the mentors and it was used to frame the conversation about their intervention work.

Case Study 004. South Asian Youth Action (SAYA!) Recent Trends in Absenteeism: Step 4
Step 4 - Build
I built out the visualization using Tableau software. The final result would be projected on a large screen during the team’s weekly meeting and I felt that Tableau was the the best choice for that type of presentation.
SAYA Attendance Trends: Work Process Step 4 of 5
Step 4 - Build
I built out the visualization using Tableau software. The final result would be projected on a large screen during the team’s weekly meeting and I felt that Tableau was the the best choice for that type of presentation.
Case Study 004. South Asian Youth Action (SAYA!) Recent Trends in Absenteeism: Step 5
Step 5 - Publish
I published the finished visualization to Tableau online and I shared it with program administrators via secure link. At the weekly team meeting, the visualization was projected on a large screen located at the front of the room. It was used to guide the team’s conversations about the what was causing the recent changes in attendance and what stratgegies they could use to intervene.
SAYA Attendance Trends: Work Process Step 5 of 5
Step 5 - Publish
I published the finished visualization to Tableau online and I shared it with program administrators via secure link. At the weekly team meeting, the visualization was projected on a large screen located at the front of the room. It was used to guide the team’s conversations about the what was causing the recent changes in attendance and what stratgegies they could use to intervene.

Case Study 003. South Asian Youth Action (SAYA!) Attendance Tracker: Step 4
Step 4 - Build
I built out the visualization using Tableau software. The final result would be projected on a large screen during the weekly meetings and I felt that Tableau was the the best choice for that type of presentation.
SAYA Attendance Tracker: Work Process Step 4 of 5
Step 4 - Build
I built out the visualization using Tableau software. The final result would be projected on a large screen during the weekly meetings and I felt that Tableau was the the best choice for that type of presentation.
Case Study 003. South Asian Youth Action (SAYA!) Attendance Tracker: Step 5
Step 5 - Publish
I published the finished visualization to Tableau online and I shared it with program administrators via secure link. At the weekly meetings, the visualization was projected on a large screen located at the front of the room. The visualization provided a common point of reference for the team and it was used to frame the conversations they were having about their shared work.
SAYA Attendance Tracker: Work Process Step 5 of 5
Step 5 - Publish
I published the finished visualization to Tableau online and I shared it with program administrators via secure link. At the weekly meetings, the visualization was projected on a large screen located at the front of the room. The visualization provided a common point of reference for the team and it was used to frame the conversations they were having about their shared work.

Case Study 001. GCCS Dashboard: Step 4
Step 4 - Build
Now we come to the fun part—taking dry, lifeless data files and turning them into vibrant, engaging data visualizations. For this organization’s needs, I felt that Tableau was the best tool for the job.
Step 4 - Build
Now we come to the fun part—taking dry, lifeless data files and turning them into vibrant, engaging data visualizations. For this organization’s needs, I felt that Tableau was the best tool for the job.

Case Study 001. GCCS Dashboard: Step 5
Step 5 - Publish
I published the dashboard online using Tableau. Board members and school leaders could access their new dashboard on any computer or mobile device from anywhere in the world. Once the dashboard was in use, I noticed a big change in the way Board meetings were conducted—rather than using the meetings to gather information as they had before, now, since they had up-to-data information constantly available to them through the dashboard, every member arrived at the meeting already conversant in the data. The meetings went from an exercise in simply finding out what’s happening and turned into a forum to discuss why things are happening. Thanks to the dashboard, Board meetings were now more directly focused on finding solutions.
Step 5 - Publish
I published the dashboard online using Tableau. Board members and school leaders could access their new dashboard on any computer or mobile device from anywhere in the world. Once the dashboard was in use, I noticed a big change in the way Board meetings were conducted—rather than using the meetings to gather information as they had before, now, since they had up-to-data information constantly available to them through the dashboard, every Board member arrived at the meeting already conversant in the data. The meetings went from an exercise in simply finding out what’s happening and turned into a forum to discuss why things are happening. Thanks to the dashboard, Board meetings were now more directly focused on finding solutions.