

Case Study 015. Harlem Link Data Suite - School Operations: Step 1
Step 1 - Discovery
To begin the process of creating the data reports, I met with the school’s teachers and administrators. I listened to the concerns they had and the challenges they were facing. I began to form an idea of what information needed to be included in the data reports and what raw data needed to be gathered.

Harlem Link Data Suite - School Operations: Step 1
Step 1 - Discovery
To begin the process of creating the data reports, I met with the school’s teachers and administrators. I listened to the concerns they had and the challenges they were facing. I began to form an idea of what information needed to be included in the data reports and what raw data needed to be gathered.

Case Study 015. Harlem Link Data Suite - School Operations: Step 2
Step 2 - Sketch
Next, I made a rough sketch of what the reports would look like and what information would go where on the screen.

Harlem Link Data Suite - School Operations: Step 2
Step 2 - Sketch
Next, I made a rough sketch of what the reports would look like and what information would go where on the screen.

Case Study 015. Harlem Link Data Suite - School Operations: Step 3
Step 3 - Prep Data
To complete this step, I took the following actions:
I identified exactly what data needed to be displayed.
I identified sources for each of those data points.
I exported that data from school information systems (or requested a data export from an outside source).
I cleaned up and organized the data exports.
I compiled the data into Google Sheets.

Harlem Link Data Suite - School Operations: Step 3
Step 3 - Prep Data
To complete this step, I took the following actions:
I identified exactly what data needed to be displayed.
I identified sources for each of those data points.
I exported that data from school information systems (or requested a data export from an outside source).
I cleaned up and organized the data exports.
I compiled the data into Google Sheets.

Case Study 015. Harlem Link Data Suite - School Operations: Step 4
Step 4 - Build
Next, I took the Google Sheets datasources I’d just compiled and I connected them to Google Data Studio. I began to build out the reports inside of Data Studio.

Harlem Link Data Suite - School Operations: Step 4
Step 4 - Build
Next, I took the Google Sheets datasources I’d just compiled and I connected them to Google Data Studio. I began to build out the reports inside of Data Studio.

Case Study 015. Harlem Link Data Suite - School Operations: Step 5
Step 5 - Publish
I published the finished reports to the cloud using Google Data Studio and I shared them with all stakeholders. Since the documents were based online, all members of the team could access them throughout the day whenever they needed to.

Harlem Link Data Suite - School Operations: Step 5
Step 5 - Publish
I published the finished reports to the cloud using Google Data Studio and I shared them with all stakeholders. Since the documents were based online, all members of the team could access them throughout the day whenever they needed to.
Case Study 014. Exploratory Data Analysis: Pre-Work
Pre-Work
In this exploratory data analysis I explored a dataset of information on public schools in the United States. The underlying data was made freely available to the public and I obtained it from the U.S. Department of Education website.
Exploratory Data Analysis: Work Process Pre-Work
Pre-Work
In this exploratory data analysis I explored a dataset of information on public schools in the United States. The underlying data was made freely available to the public and I obtained it from the U.S. Department of Education website.

Case Study 014. Exploratory Data Analysis: Step 1
Step 1 - Prepare the Workspace
Since I was working with a fairly large dataset, I decided that Python was the best tool to use to analyze it. I used a Jupyter Notebook to run my code.

Exploratory Data Analysis: Work Process Step 1 of 5
Step 1 - Prepare the Workspace
Since I was working with a fairly large dataset, I decided that Python was the best tool to use to analyze it. I used a Jupyter Notebook to run my code.

Case Study 014. Exploratory Data Analysis: Step 2
Step 2 - Describe the Characteristics of the Dataset
First, I wanted to wrap my head around the dataset by finding out exactly what size it was and specifically what kind of information (variables) it contained.

Exploratory Data Analysis: Work Process Step 2 of 5
Step 2 - Describe the Characteristics of the Dataset
First, I wanted to wrap my head around the dataset by finding out exactly what size it was and specifically what kind of information (variables) it contained.

Case Study 014. Exploratory Data Analysis: Step 3
Step 3 - Summarize the Dataset
Next, I did some basic calculations to produce a set of summary statistics.

Exploratory Data Analysis: Work Process Step 1 of 5
Step 3 - Summarize the Dataset
Next, I did some basic calculations to produce a set of summary statistics.

Case Study 014. Exploratory Data Analysis: Step 4
Step 4 - Visualize the Dataset
Then, I made a number of visualizations that helped me to better understand what the data was saying.

Exploratory Data Analysis: Work Process Step 4 of 5
Step 4 - Visualize the Dataset
Then, I made a number of visualizations that helped me to better understand what the data was saying.

Case Study 014. Exploratory Data Analysis: Step 5
Step 5 - Identify Insights
Finally, I could draw some insights from the dataset. Here are the main takeaways:
The dataset consists of 51 rows and 42 columns
The dataset consists of:
student enrollment
school staffing
student demographic information
There are 51 rows and 42 columns in the dataset. None of the rows are blank.
The dataset contains totals per state of the number of students in (2) gender categories and (7) race/ethnicity categories.
2018-19 US public school total enrollments by demographic group are as follows:
25.8 million male students
24.4 million female students
473K American Indian/Alaska Native students
2.6 million Asian or Asian/Pacific Islander students
13.7 million Hispanic students
7.6 million Black students
23.7 million White students
176K Hawaiian Nat./Pacific Isl. students
2 million multiracial students
The states with the highest number of Black public school students are: Florida, Georgia and Texas
The states with the highest number of Hispanic public school students are: California and Texas
The state with the highest number of Asian or Asian/Pacific Islander public school students is California. New York and Texas are a distant second and third.The states with the highest number of American Indian/Alaska Native public school students by far is OklahomaThe state with the highest number of Hawaiian/Pacific Islander public school students by far is HawaiiThe states with the highest number of White public school students are: California and Texas

Exploratory Data Analysis: Work Process Step 5 of 5
Step 5 - Identify Insights
Finally, I could draw some insights from the dataset. Here are the main takeaways:
The dataset consists of 51 rows and 42 columns
The dataset consists of:
student enrollment
school staffing
student demographic information
There are 51 rows and 42 columns in the dataset. None of the rows are blank.
The dataset contains totals per state of the number of students in (2) gender categories and (7) race/ethnicity categories.
2018-19 US public school total enrollments by demographic group are as follows:
25.8 million male students
24.4 million female students
473K American Indian/Alaska Native students
2.6 million Asian or Asian/Pacific Islander students
13.7 million Hispanic students
7.6 million Black students
23.7 million White students
176K Hawaiian Nat./Pacific Isl. students
2 million multiracial students
The states with the highest number of Black public school students are: Florida, Georgia and Texas
The states with the highest number of Hispanic public school students are: California and Texas
The state with the highest number of Asian or Asian/Pacific Islander public school students is California. New York and Texas are a distant second and third.The states with the highest number of American Indian/Alaska Native public school students by far is OklahomaThe state with the highest number of Hawaiian/Pacific Islander public school students by far is HawaiiThe states with the highest number of White public school students are: California and Texas

Case Study 013. Jazzfuel.com COVID-19 Survey Results Visualization: Step 1
Step 1 - Discovery
My very first step was to meet with the client and determine what his needs were for the project.
From our conversation, I learned that his goal was to create a visual that:
quickly summarized the survey’s key points of information
could be posted online and shared via his email newsletter
allowed users to filter the data by demographic subgroup (location, age, etc.)
stimulated further discussion amongst members of the community

Jazzfuel Dashboard: Work Process Step 1 of 5
Step 1 - Discovery
My very first step was to meet with the client and determine what his needs were for the project.
From our conversation, I learned that his goal was to create a visual that:
quickly summarized the survey’s key points of information
could be posted online and shared via his email newsletter
allowed users to filter the data by demographic subgroup (location, age, etc.)
stimulated further discussion amongst members of the community

Case Study 013. Jazzfuel.com COVID-19 Survey Results Visualization: Step 2
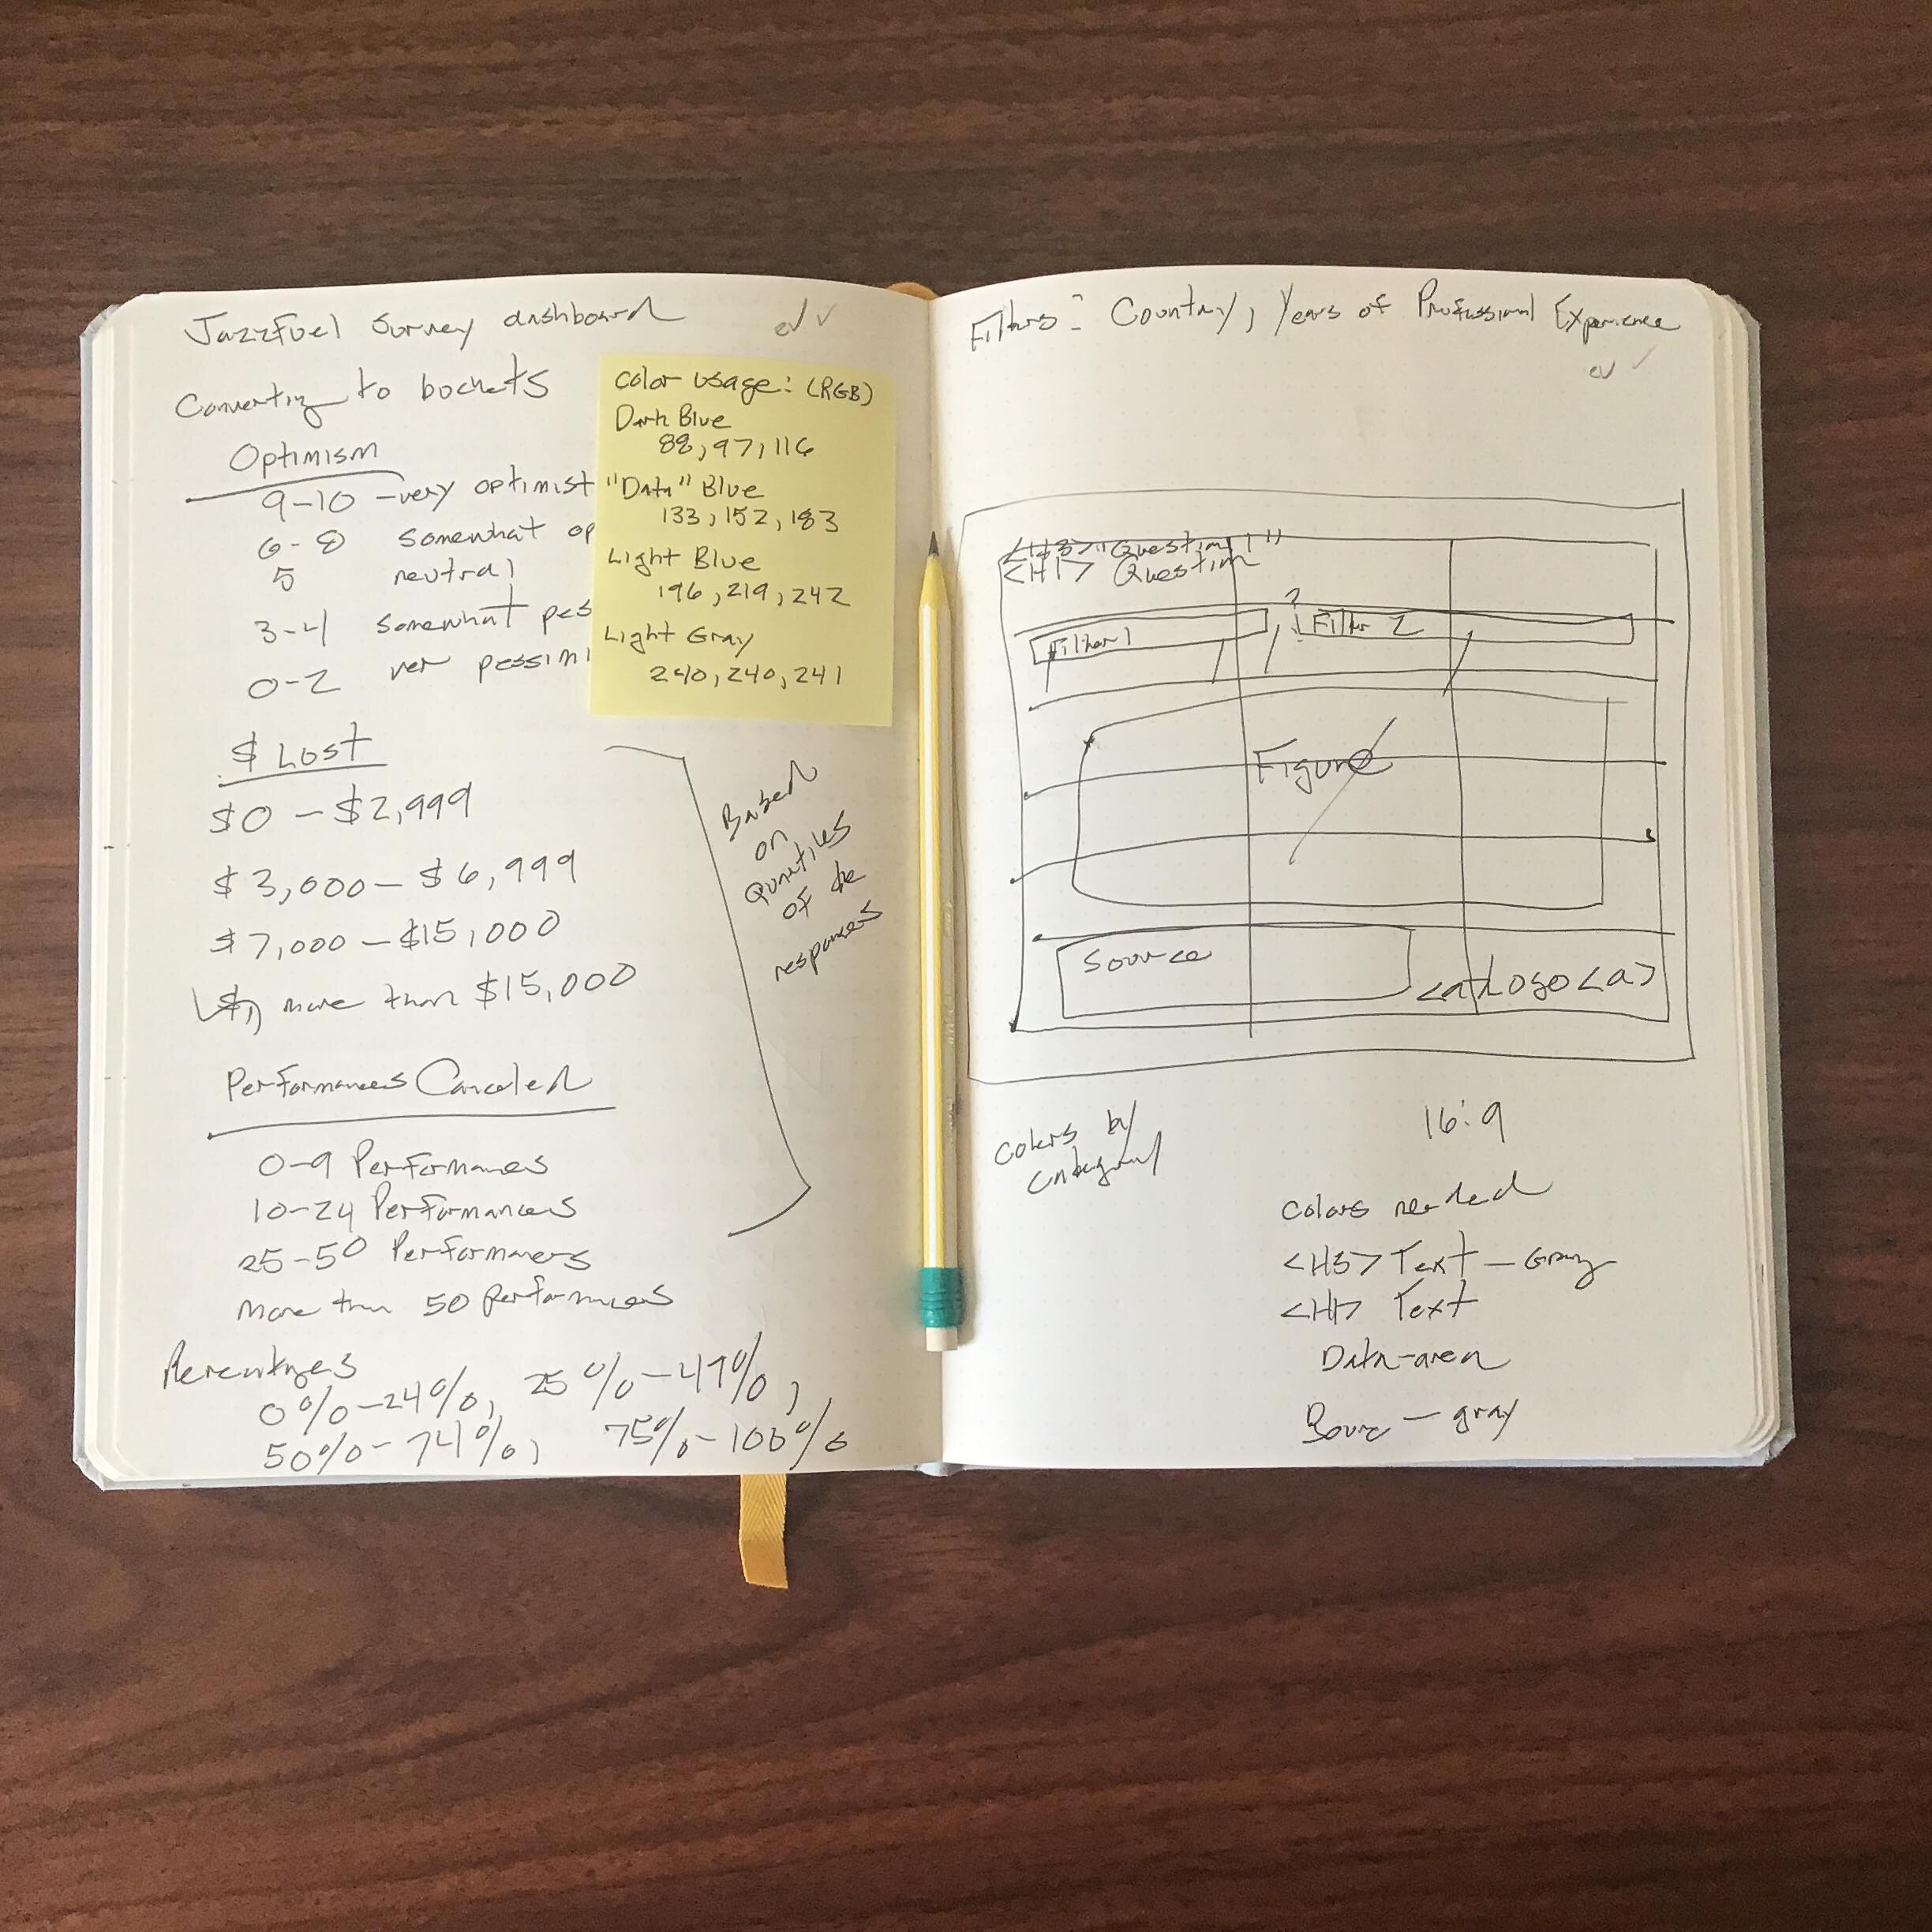
Step 2 - Sketch
Next, I made a rough sketch of what the visualizaion would look like and what information would go where on the screen.
Jazzfuel Dashboard: Work Process Step 2 of 5
Step 2 - Sketch
Next, I made a rough sketch of what the visualization would look like and what information would go where on the screen.

Case Study 013. Jazzfuel.com COVID-19 Survey Results Visualization: Step 3
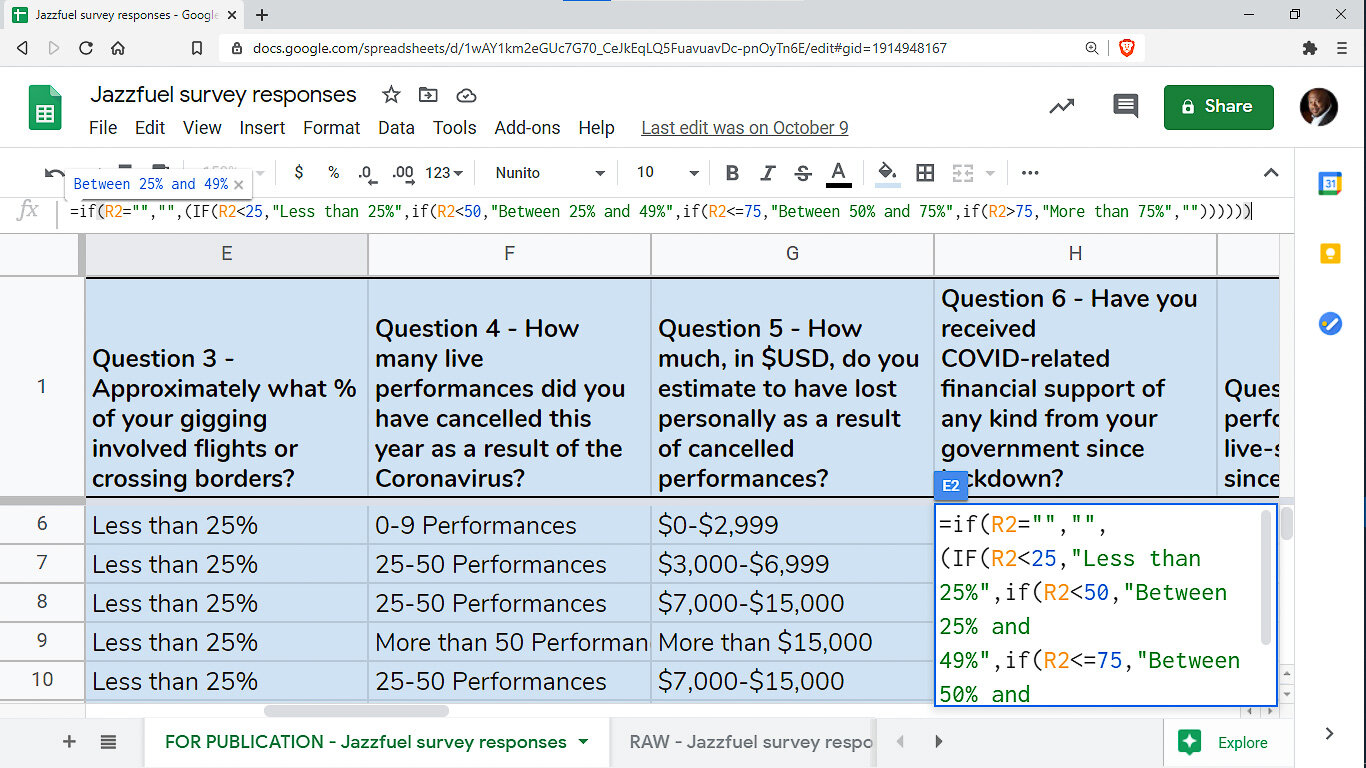
Step 3 - Prep Data
I took the granular, row-by-row data from the survey responses and I organized it in a way that would allow it to be translated into clear visuals.
Jazzfuel Dashboard: Work Process Step 3 of 5
Step 3 - Prep Data
I took the granular, row-by-row data from the survey responses and I organized it in a way that would allow it to be translated into clear visuals.
Case Study 013. Jazzfuel.com COVID-19 Survey Results Visualization: Step 4
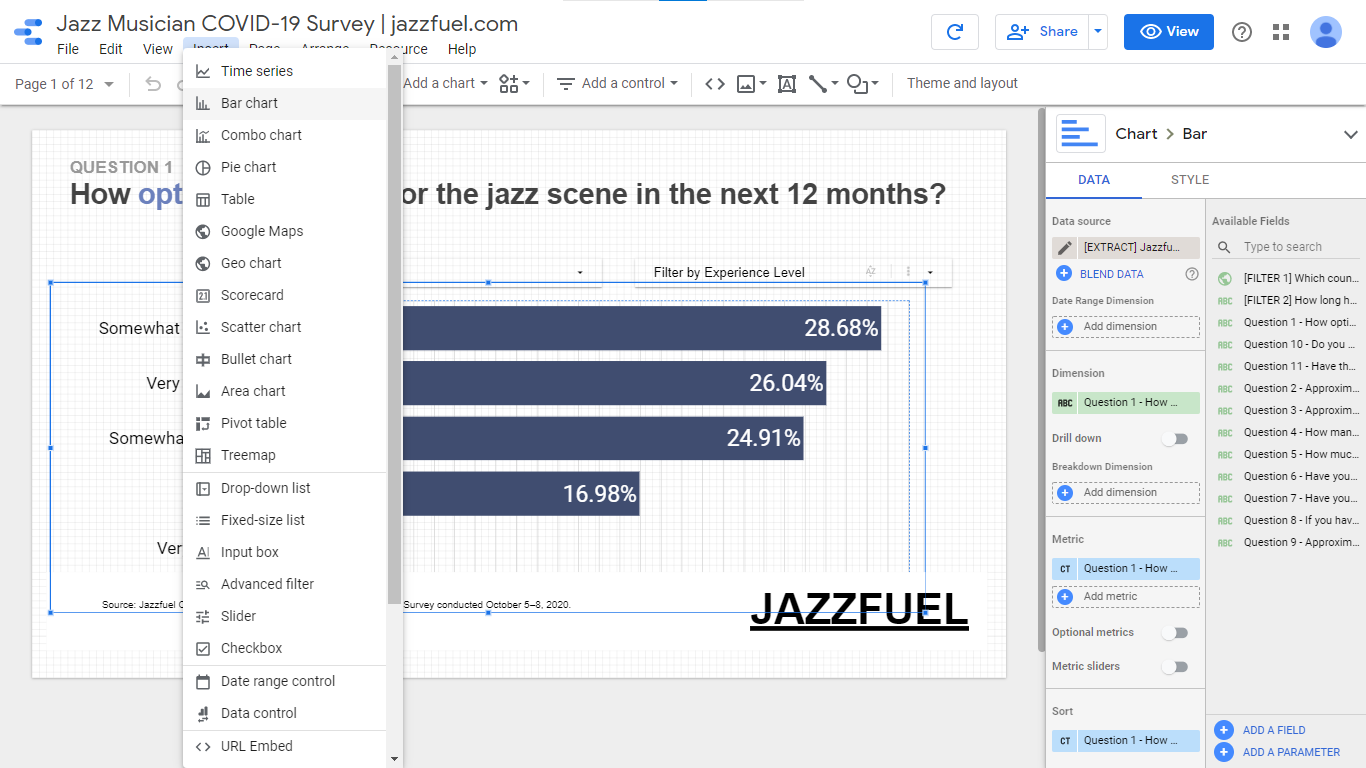
Step 4 - Build
To build out the visualization, I chose to use Google Data Studio. I chose Data Studio because it can easily be shared (via a link) and/or embedded into a website.

Jazzfuel Dashboard: Work Process Step 4 of 5
Step 4 - Build
To build out the visualization, I chose to use Google Data Studio. I chose Data Studio because it can easily be shared (via a link) and/or embedded into a website.

Case Study 013. Jazzfuel.com COVID-19 Survey Results Visualization: Step 5
Step 5 - Publish
Once I finished building out the visualization and connecting it to the data source, I published the visualization and shared it online.

Jazzfuel Dashboard: Work Process Step 5 of 5
Step 5 - Publish
Once I finished building out the visualization and connecting it to the data source, I published the visualization and shared it online.
Case Study 005. South Asian Youth Action (SAYA!) Weather vs. Attendance Tracker: Step 1
Step 1 - Discovery
To begin the process of creating the visualization, I met with the administrators of the intervention program and the mentors who worked directly with the students. I listened to the concerns they had and we talked about the challenges they were facing. I began to form an idea of what information needed to be included in the visualization and what raw data needed to be gathered.

SAYA Attendance vs. Weather: Work Process Step 1 of 5
Step 1 - Discovery
To begin the process of creating the visualization, I met with the administrators of the intervention program and the mentors who worked directly with the students. I listened to the concerns they had and we talked about the challenges they were facing. I began to form an idea of what information needed to be included in the visualization and what raw data needed to be gathered.

Case Study 005. South Asian Youth Action (SAYA!) Weather vs. Attendance Tracker: Step 2
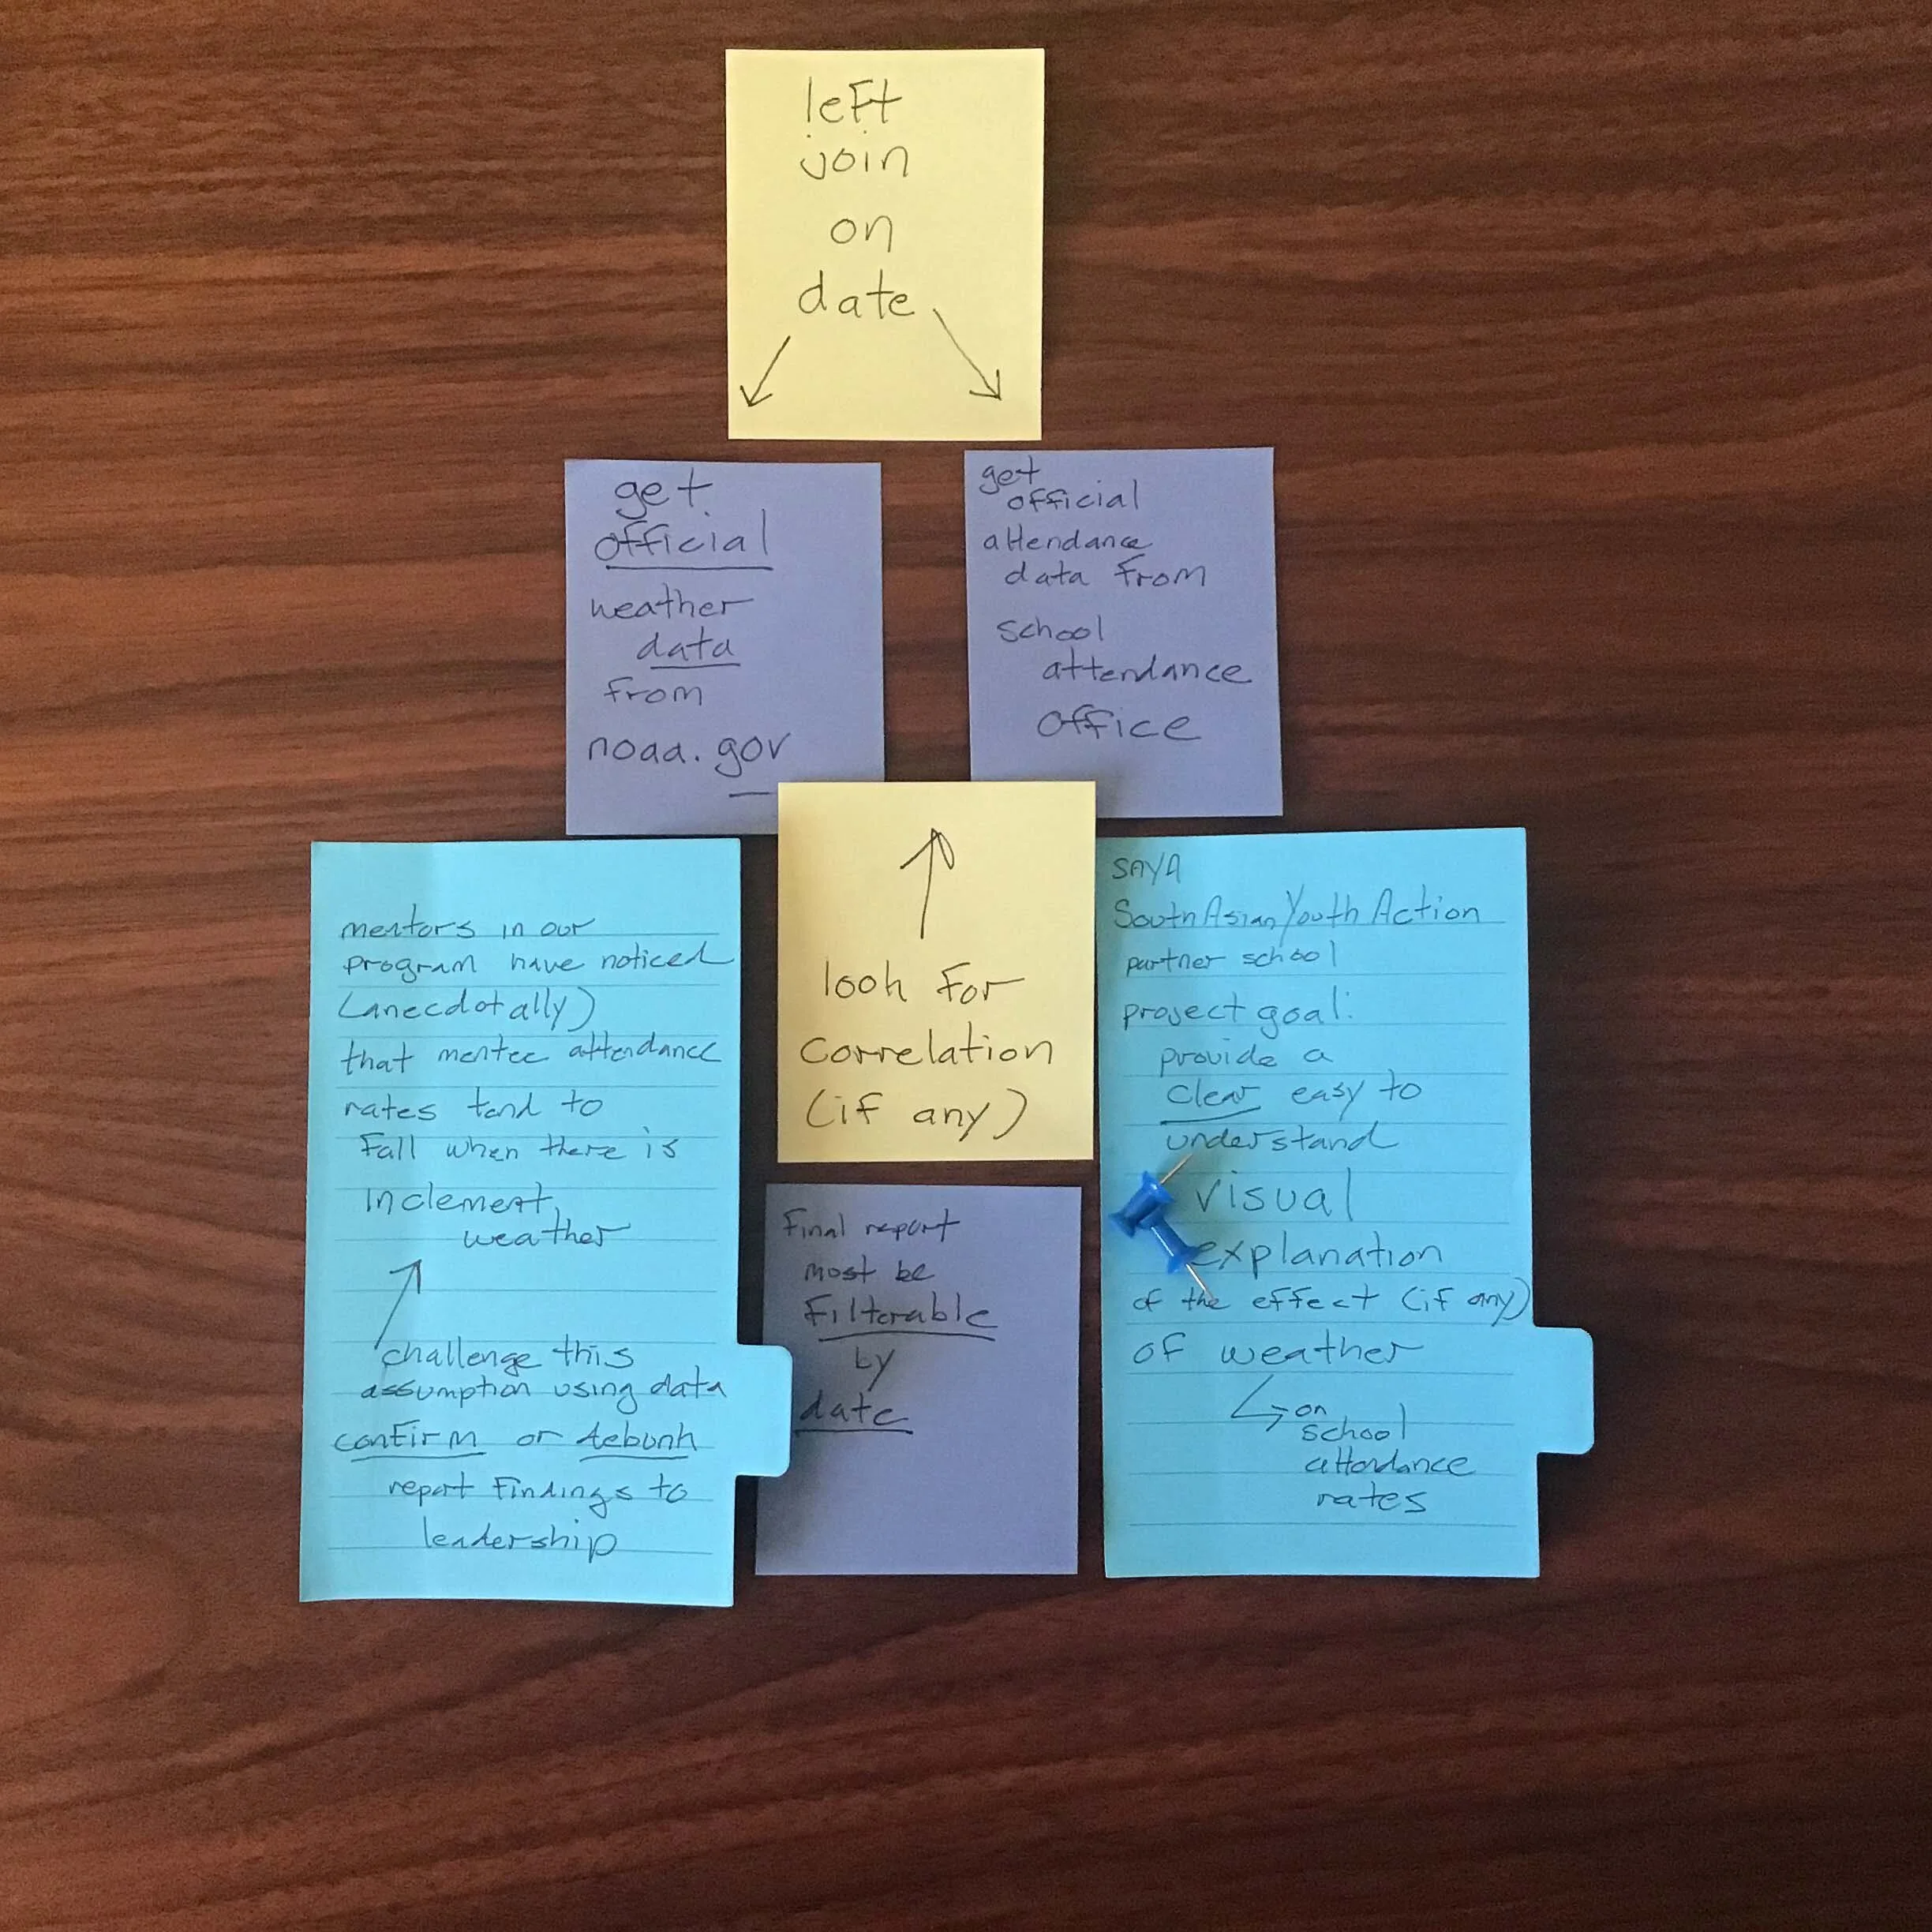
Step 2 - Sketch
Next, I made a rough sketch of what the visualization would look like and what information would go where on the screen.

SAYA Attendance vs. Weather: Work Process Step 2 of 5
Step 2 - Sketch
Next, I made a rough sketch of what the visualization would look like and what information would go where on the screen.

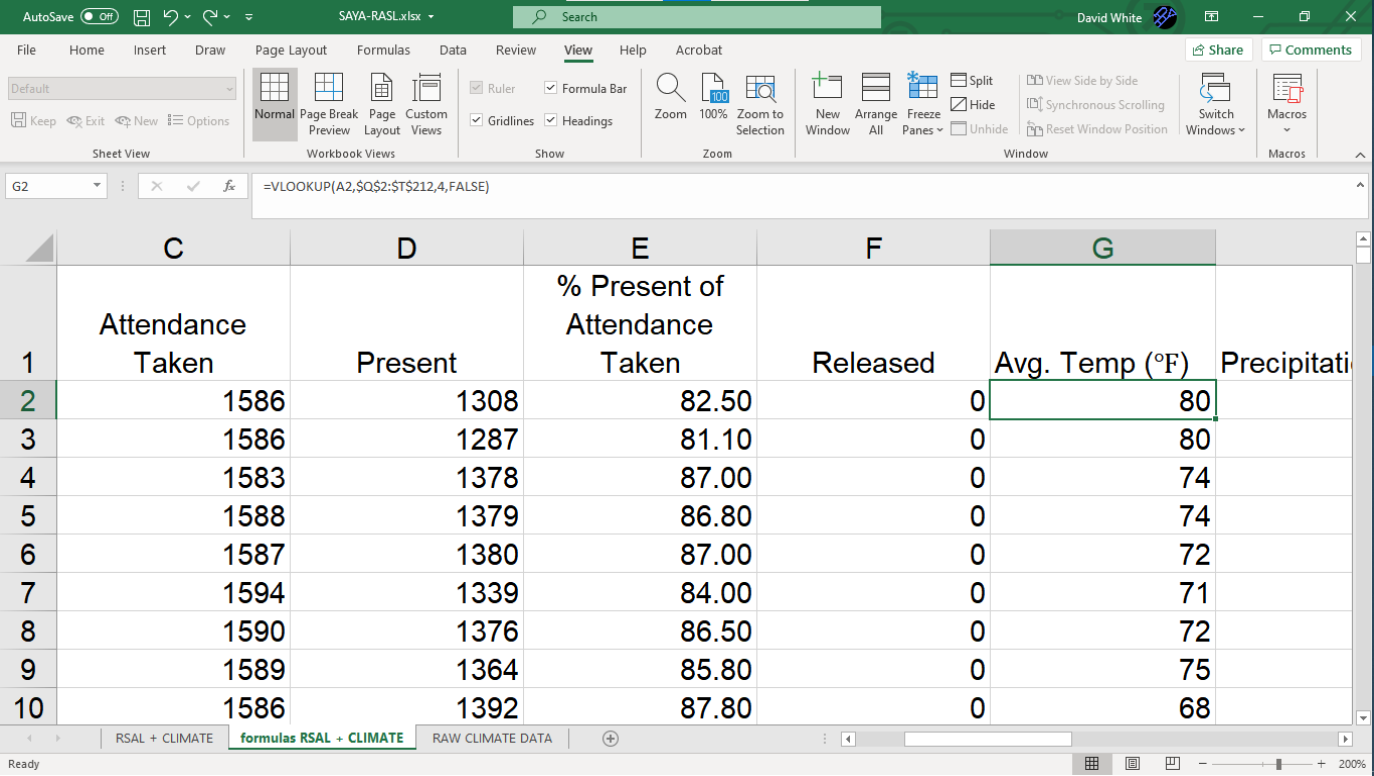
Case Study 005. South Asian Youth Action (SAYA!) Weather vs. Attendance Tracker: Step 3
Step 3 - Prep Data
I collected the school’s attendance data and I joined it with local weather data published by the National Oceanic and Atmospheric Administration (NOAA). Then I lined up the daily attendance data with the NOAA weather data for that school day.
SAYA Attendance vs. Weather: Work Process Step 3 of 5
Step 3 - Prep Data
I collected the school’s attendance data and I joined it with local weather data published by the National Oceanic and Atmospheric Administration (NOAA). Then I lined up the daily attendance data with the NOAA weather data for that school day.

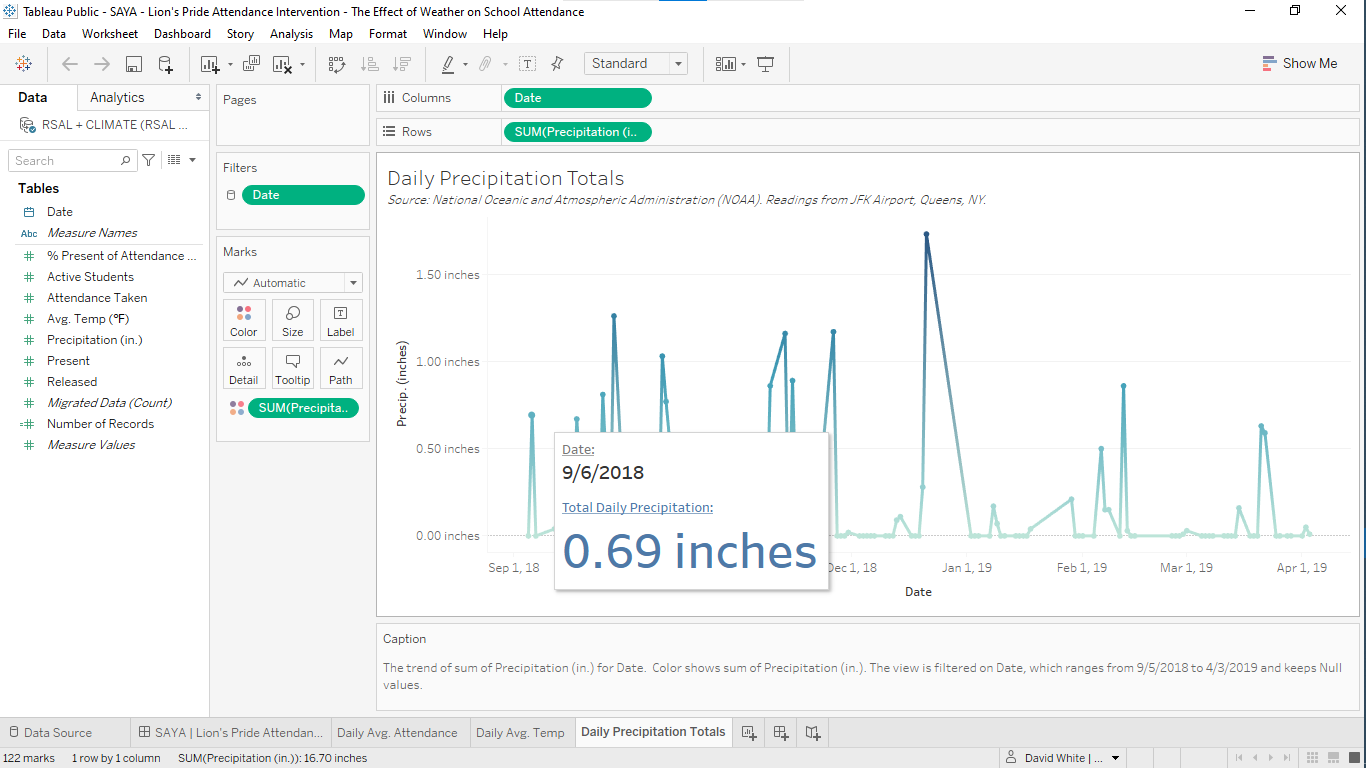
Case Study 005. South Asian Youth Action (SAYA!) Weather vs. Attendance Tracker: Step 4
Step 4 - Build
I built out the visualization using Tableau software. The final result would be projected on a large screen during the team’s weekly meeting and I felt that Tableau was the the best choice for that type of presentation.
SAYA Attendance vs. Weather: Work Process Step 4 of 5
Step 4 - Build
I built out the visualization using Tableau software. The final result would be projected on a large screen during the team’s weekly meeting and I felt that Tableau was the the best choice for that type of presentation.