
Friday, July 9, 2021
Insights, Made Fresh Daily
Diverse Backgrounds
The demographic makeup of each NYC school district
David White | Friday, July 9, 2021
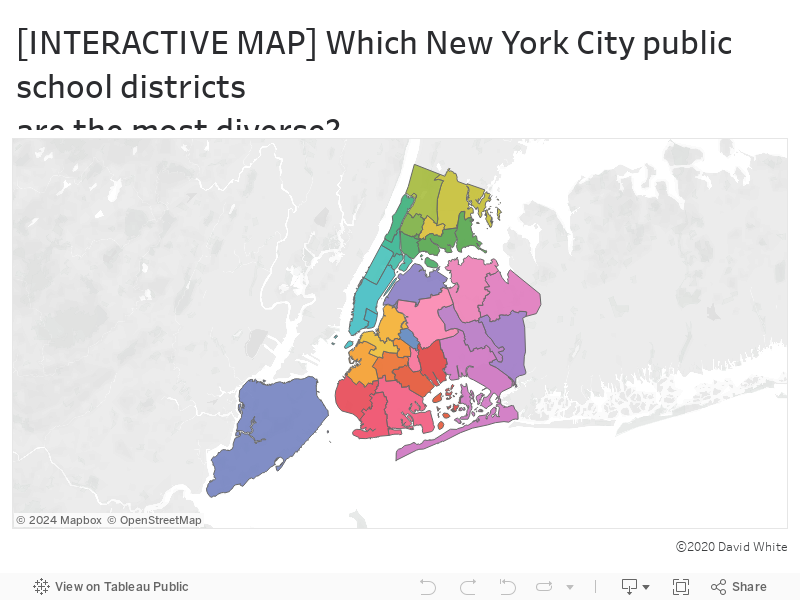
This interactive map shows the racial composition of each of New York City’s community school districts. Hover your mouse (or tap if you’re using a mobile device) to learn more about each district. The underlying data was released by the City of New York.